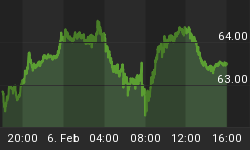
Years ago, when I was conducting Technical Analysis Seminars, I would post a chart similar to the one below. Take a moment to observe the chart and answer the question before scrolling down further.

In regard to the "Where is this going next?" question, many would suggest that there is a possibility that this pattern would test the upside resistance and then break out to the upside.
BUT ... many of you probably already guessed that this was a trick question. The chart is the inverted SPY chart.
Turning any chart upside down is often helpful to technicians, as it often helps to take away any bias or wishful thinking while in of process of analyzing charts.
So here is the real chart below ... in the full upright position it belongs in. You can see that the SPY is still trending higher now because it has higher/lows and higher/highs.
But, it is trending up below its primary up channel. The new channel is a lesser channel where the upside resistance is where the old channel's support used to be.
So the previous support has become resistance in this secondary channel. This is not what you really want to see in a Bull market, so it should tell you to look harder at other indicators and/or conditions to see if something else,more serious could be developing. Please see the FYI message below ...

Friday ALERT Message: FYI ... For those of you who are not paid subscribers yet, I want to make you aware of a "Special Report message" I posted this morning on the Standard subscriber site. Part of this morning's text is below ...
* There are some longer term conditions that we NEED to discuss relating to the Banking Index, the Institutional Index, the 30 year yields, and a diminishing level of Institutional Accumulation on each wave up. Combine this with QE2 ending in June, and U.S. Debt problems ... and this "could" become a major problem. It's only a "could be" right now, but one that I am concerned enough about to keep it on my radar.
** On Monday morning, the Treasury Dept. expects the that we will reach the current $14.3 Debt Ceiling limit. Bernanke sent out a warning that Congress is risking "grave consequences" by playing a game of chicken with the debt ceiling. Some Congressmen aren't worried, saying that they have until August 2nd. before the Treasury goes into default. Default? A game of chicken? Looks like it.
*** NOTE** In any event, I will put together a Special Report for Monday morning that will show you the possible seriousness of upcoming conditions. Its purpose is not meant to scare you, but ... its purpose is meant to keep you fully informed about significant events that are approaching.


