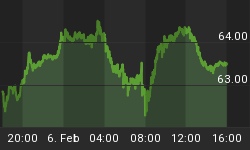
For the first time since September 10, 2010, the "dumb money" indicator has turned bearish. The Rydex market timers continue to remain extremely bullish, and company insiders are non-committal. Consecutive weeks of investor bearishness as seen in the "dumb money" indicator is generally the best time to buy. Ideally, it would be nice to have additional confirming evidence such as buying from company insiders, and it is possible that lower prices might bring out the buyers especially as prices approach the November, 2010 highs and flirt with the 200 day moving average on the major indices. Regardless how it goes over the next couple of weeks, what is undeniable is this: 1) markets tend to bottom when there are too many bears; for example, since 1991 covering 40 unique instances, the SP500 bottomed 80% of the time with a reasonable risk (<6% draw down) to capital after two consecutive weeks of extreme bearish sentiment and ; 2) failure of the market to bottom is a very ominous sign.
The "Dumb Money" indicator (see figure 1) looks for extremes in the data from 4 different groups of investors who historically have been wrong on the market: 1) Investors Intelligence; 2) MarketVane; 3) American Association of Individual Investors; and 4) the put call ratio. This indicator is extremely bearish.
Figure 1. "Dumb Money"/ weekly
Figure 2 is a weekly chart of the SP500 with the InsiderScore "entire market" value in the lower panel. From the InsiderScore weekly report: "Market-wide insider sentiment was once again neutral as insiders continued along a cautious path."
Figure 2. InsiderScore "Entire Market" value/ weekly
Figure 3 is a weekly chart of the SP500. The indicator in the lower panel measures all the assets in the Rydex bullish oriented equity funds divided by the sum of assets in the bullish oriented equity funds plus the assets in the bearish oriented equity funds. When the indicatoris green, the value is low and there is fear in the market; this is where market bottoms are forged. When the indicator is red, there is complacency in the market. There are too many bulls and this is when market advances stall.
Currently, the value of the indicator is 65.96%. Values less than 50% are associated with market bottoms. Values greater than 58% are associated with market tops.
Figure 3. Rydex Total Bull v. Total Bear/ weekly
If you would like to have TheTechnicalTake delivered to your email in box, please click here: It's free!!!
Let me also remind readers of our Premium Content service, which focuses on daily market sentiment and the Rydex asset data.


