


Until recently, and in some cases until this very day, we had weakness in the US dollar, strength in bonds, a sharp sell-off in commodity prices, a strong rebound in US as well as foreign stocks, and a minor increase in interest rates in China! What does it all mean for us investors and where will we go from here?
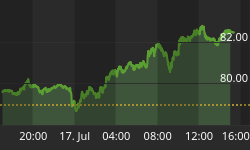
It is true that recently the US dollar has recently broken down, but when we look at the performance of the US dollar since the beginning of the year we note that so far the dollar decline in 2004 has been very moderate (see figure 1).
Figure 1:
Source: Gavekal
Against the Canadian dollar the US dollar has, so far in 2004, lost 6% but just about 2% against the Euro and it has actually gained against the Australian dollar and the Mexican peso. Therefore, it would be premature to speak about a "dollar crisis" for now. I agree that in the long run the US dollar is a doomed currency, but against what? I cannot see any great value in the Euro, but I still like Asian currencies such as the Singapore dollar, and of course gold and silver, since they are currencies, for which the supply cannot be increased by some intellectually totally corrupt central bankers whose monetary policies will ensure the complete loss of paper money's purchasing power sometime in the future. Concerning the US dollar, much further weakness would somewhat surprise me because, as can be seen from figure 2, US money supply has not been growing much since the month of May of this year.
Figure 2:
Source: Federal Reserve Bank of St. Louis
In my opinion, for the US dollar to really collapse one would need a strong rise in money supply, which as can be seen above is not taking place at the present time. But there are other reasons why I do not expect a significant breakdown in the value of the US dollar right now.
It would appear that the US economy, which was largely driven by expanding credit leading to a strong increase in home prices, which allowed households to extract money from their homes and spend it on consumer goods, and tax cuts, whose impact are now history, is slowing down. The overheated housing market is showing signs of weakening and the shares of sub-prime and mortgage lenders have recently been hit as their earnings, which depend largely on re-financing of homes activity have been disappointing (see figure 3).
Figure 3:
Source: http://www.decisionpoint.com/
The break in financial stocks is, in my opinion relevant for the entire stock market. Since 2000, financial stocks have significantly out-performed the stock market and their superb performance was a symptom of the credit bubble, which drove the US real estate market and US consumption. Declining financial stocks are on the other hand indicative that not all is well in the credit market and that excess credit growth is either slowing down or that in some sectors of the economy credit is declining altogether, which would be negative for the entire US economy. Moreover, when financial stocks break down, and at the same time home building shares and lumber, sell-off, we should assume that the housing market is in trouble (see figure 4).
Figure 4: Lumber Prices October 2003- October 2004
Source: http://www.future.tradingcharts.com/
I may add that the strength in bond prices until just a few days ago would support the notion that the economy is likely to weaken in the period directly ahead. In fact, it is bizarre that US bond prices have been as strong as they were over the last six months given the US dollar weakness (see figure 5). Usually, if a currency weakens one would expect fixed interest securities to also decline, but in this instance we had the opposite.
Figure 5:
Source: http://www.decisionpoint.com/
I am mentioning this "unusual" condition because "normally" one would also find bond prices going down when oil prices and commodities rise, as commodity price increases are perceived as inflationary. But now we had in the last ten days oil moving down and bonds selling off at the same time. So, do recent movements in the various asset markets make any sense??
Now, across the Pacific Ocean , in the Middle Kingdom, we also get the impression that the economy is decelerating faster than is generally perceived. Car sales in September and October were down year-on-year, and from sources on the ground we hear of very high inventories exist among manufacturing companies (telephone handset inventories could be as high as 60 million units, with domestic sales having slowed down). Moreover, as can be seen from figure 6, the imports of copper and steel have been slowing down very rapidly, which indicates that either the Chinese economy is cooling off rapidly or that the Chinese have earlier this year accumulated large inventories of just about every commodity.
Figure 6:
Source: The Bank Credit Analyst, http://www.bca.com/
In the first nine months of this year, Chinese imports of oil rose by 34% year on year. Now, I am certain that in the long run Chinese oil consumption will increase year-in-year out, but I very much doubt that China's oil consumption will rise at more than 30% annual rates for long! At very best, I would expect Asian including Chinese oil consumption to rise by about 8% per annum (which would still call for Asian oil consumption to double from daily 20 million barrels daily to 40 million barrels in less than ten year - please note that total global oil production averages now 80 million barrels per day). Therefore, if inventories have been increasing, it is quite possible that we have already seen the highs for the oil market for the intermediate term (see figure 7).
Figure 7:
Source: http://www.decisionpoint.com/
The same would be true of the US where inventories have been rising because of the oil purchases for the purpose of increasing the strategic oil reserves (probably in anticipation of a strike against Iran's nuclear facilities in early 2005, which would, in my opinion, create a horrible mess in the Middle East, as Iranians would immediately attack US troops in Iraq). But for now, if the Chinese economy indeed decelerates by as much as I think it will, and experiences in 2005 some kind of hard landing while at the same time the US economy, as indicated above slows down, commodity prices may already have peaked out or may shortly do so. Certainly, the recent sharp break in the prices of industrial commodities such as Nickel, Copper, Aluminum and most recently also oil would suggest that these markets have already reversed or have, at the very least, become vulnerable to "lower than expected" demand shocks!
So, markets do make some sense after all. The US and global bond markets have been firm, because the US and the Chinese economy are weakening. The recent weakness in the US bond market can probably be explained by dollar weakness, which may lead to some more inflation and by recent strong employment gains, which however, are suspect, in my opinion. Equities have rallied because if the economy weakens, the US Federal Reserve will in future not increase interest rate by more than 0.25% in November - if at all. Moreover, the Bush victory is perceived to be positive for the economy and corporate profits for now, but what about the geopolitical consequences??? Lastly, commodity markets are beginning to sell-off because of disappointing demand from China and also increased supplies for industrial commodities.
But this is all "old news" and I am interested in what will happen from here onward for the next few months.
If oil and other commodity prices decline, it will likely be perceived by the investment community as positive for global growth and bullish for stocks (I am not suggesting that I agree with this interpretation, but this is what the market might think). Therefore, if commodity prices come off, stocks around the world could rally for another month or so, while bond prices continue to retreat. Also in favor of some further stock market strength is the fact that almost always in an election year the stock market bottoms out around election time, irrespective whether a Democrat or a Republican wins and begins to rally into January (see figure 8 and figure 9, courtesy of Bob Hoye who produces some of the best historical figures). I must add that this is also a period of seasonal strength for equities.

Source: Bob Hoye, http://www.institutionaladvisors.com/
As can be seen, in the case of the Clinton election in 1992, the stock market bottomed out in early October and rallied thereafter moderately. In the case of the 1988 George Bush election, the market only bottomed out in early November, but then rallied quite strongly (see figure 9).
Figure 9: Stock Market performance in Election Years
Source: Bob Hoye, http://www.institutionaladvisors.com/
However, before turning overly bullish on the outlook for equities and also in order to tame the enthusiasm of investors that a new bull market has begun, I need to add some cautionary remarks. First of all, many post election rallies fizzle out relatively soon and give way to renewed weakness. Secondly, when the NASDAQ out-performs the Dow Jones Industrial, as has been the case since August, it frequently leads to a more important peak in the NASDAQ from where it breaks down quite sharply. Lastly, the Bradley Model about which we have written in the past, shows the market selling off sharply after November 11 th with a more meaningful low occurring in early December (see figure 10). This would also be consistent with the current over-bought condition of the stock market.
Figure 10: The Bradley Model
Source: Arch Crawford
Given the above thoughts, I would be looking to sell bonds now or on any modest rebound. I would also get out of industrial commodities including oil, although the fundamentals of the latter are still very favorable in the long term. With Mr. Bush having been reelected, I would, however, avoid shorting oil, as an American or Israeli strike on Iran - possibly as early as December - has almost become a certainty. With respect to stocks, I would look at selling or shorting financial and homebuilding shares as well as the NASDAQ right now or on any further near term strength. Regarding the US dollar - as a contrarian - I don't expect much further near term weakness, as the entire world is now convinced that the dollar will only go down in value (panic selling, which would lead to a more significant low, is however, a possibility). I would continue to accumulate gold and silver , despite the fact that precious metals could also come under some near term pressure if industrial commodities sell off and should the US dollar strengthen. However, I remain a believer that gold and silver will significantly out-perform the fully valued S&P 500 and maintain its purchasing power under any kind of economic scenario in the years ahead (see figure 11).
Figure 11:
Source: Ned Schmidt, (nwschmidt@earthlink.net)
Please note that the figure above shows how many S&P 500 it takes to buy one ounce of gold. So, whereas it took four S&P 500s to buy one ounce of gold in 1980, today it only takes less than half an S&P 500 to buy an ounce of gold. This suggests that gold is despite its recent rise still relatively inexpensive compared to the S&P 500. I may add that gold is also relatively inexpensive compared to the price of oil!
We wish our readers a happy festive season.


