• 1,037 days Will The ECB Continue To Hike Rates?
  • 1,037 days Forbes: Aramco Remains Largest Company In The Middle East
  • 1,039 days Caltech Scientists Succesfully Beam Back Solar Power From Space
  • 1,439 days Could Crypto Overtake Traditional Investment?
  • 1,444 days Americans Still Quitting Jobs At Record Pace
  • 1,445 days FinTech Startups Tapping VC Money for ‘Immigrant Banking’
  • 1,449 days Is The Dollar Too Strong?
  • 1,449 days Big Tech Disappoints Investors on Earnings Calls
  • 1,450 days Fear And Celebration On Twitter as Musk Takes The Reins
  • 1,451 days China Is Quietly Trying To Distance Itself From Russia
  • 1,452 days Tech and Internet Giants’ Earnings In Focus After Netflix’s Stinker
  • 1,456 days Crypto Investors Won Big In 2021
  • 1,456 days The ‘Metaverse’ Economy Could be Worth $13 Trillion By 2030
  • 1,457 days Food Prices Are Skyrocketing As Putin’s War Persists
  • 1,459 days Pentagon Resignations Illustrate Our ‘Commercial’ Defense Dilemma
  • 1,460 days US Banks Shrug off Nearly $15 Billion In Russian Write-Offs
  • 1,463 days Cannabis Stocks in Holding Pattern Despite Positive Momentum
  • 1,464 days Is Musk A Bastion Of Free Speech Or Will His Absolutist Stance Backfire?
  • 1,464 days Two ETFs That Could Hedge Against Extreme Market Volatility
  • 1,466 days Are NFTs About To Take Over Gaming?
Another Retail Giant Bites The Dust

Another Retail Giant Bites The Dust

Forever 21 filed for Chapter…

How The Ultra-Wealthy Are Using Art To Dodge Taxes

How The Ultra-Wealthy Are Using Art To Dodge Taxes

More freeports open around the…

  1. Home
  2. Markets
  3. Other

The State of the Trend

Whether markets move up, down, or sideways, market breadth goes through short-term overbought/oversold cycles. During a very strong uptrend, the market will move sideways or slightly up during a market breadth overbought cycle, while the opposite is true for strong downtrending markets.

Gregory Moris' book Market Breadth Indicators is a good introductory guide to Breadth Indicators, which allow investors to keep track of such conditions, but by no means covers all of them.

On my blog I regularly update several proprietary indicators designed to keep track of overbought/oversold market breadth conditions, and will cover some of them in this and future articles.

Let's start with a weekly DJIA, QQQ, SPX overbought/oversold oscillator:

weekly DJIA, QQQ, SPX overbought/oversold oscillator
Larger Image

And follow-up with a couple of daily overbought/oversold breadth indicators:

daily overbought/oversold breadth indicator
Larger Image

daily overbought/oversold breadth indicator
Larger Image

Although all three indicators show a different sensibility to market breath changes, they all point to a short-term oversold condition. As a result, the expectation is for a sideways/up phase to follow (in the context of broken monthly, weekly and daily uptrends).

Uptrends
Larger Image

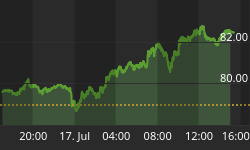
For short-term, one week price targets and areas of support/resistance, I'll turn again to daily channel analysis:

SPX


Coming soon: a new iPhone app that will help anybody, from novice to seasoned trader, make better investment decisions. Keep an eye on Twitter @citdates.


Back to homepage

Leave a comment

Leave a comment