• 309 days Will The ECB Continue To Hike Rates?
  • 309 days Forbes: Aramco Remains Largest Company In The Middle East
  • 311 days Caltech Scientists Succesfully Beam Back Solar Power From Space
  • 711 days Could Crypto Overtake Traditional Investment?
  • 716 days Americans Still Quitting Jobs At Record Pace
  • 718 days FinTech Startups Tapping VC Money for ‘Immigrant Banking’
  • 721 days Is The Dollar Too Strong?
  • 721 days Big Tech Disappoints Investors on Earnings Calls
  • 722 days Fear And Celebration On Twitter as Musk Takes The Reins
  • 724 days China Is Quietly Trying To Distance Itself From Russia
  • 724 days Tech and Internet Giants’ Earnings In Focus After Netflix’s Stinker
  • 728 days Crypto Investors Won Big In 2021
  • 728 days The ‘Metaverse’ Economy Could be Worth $13 Trillion By 2030
  • 729 days Food Prices Are Skyrocketing As Putin’s War Persists
  • 731 days Pentagon Resignations Illustrate Our ‘Commercial’ Defense Dilemma
  • 732 days US Banks Shrug off Nearly $15 Billion In Russian Write-Offs
  • 735 days Cannabis Stocks in Holding Pattern Despite Positive Momentum
  • 736 days Is Musk A Bastion Of Free Speech Or Will His Absolutist Stance Backfire?
  • 736 days Two ETFs That Could Hedge Against Extreme Market Volatility
  • 738 days Are NFTs About To Take Over Gaming?
Billionaires Are Pushing Art To New Limits

Billionaires Are Pushing Art To New Limits

Welcome to Art Basel: The…

Is The Bull Market On Its Last Legs?

Is The Bull Market On Its Last Legs?

This aging bull market may…

  1. Home
  2. Markets
  3. Other

How Low Can Gold Go on a Correction?

Gold is in the second phase of a Bump-and-Run Reversal Top pattern, which typically occurs when excessive speculation drives prices up steeply, and is now at a critical juncture where substantially lower prices could be realized. Let me explain.

According to Thomas Bulkowski, the Bump-and-Run Reversal Top pattern (read here for details) consists of three main phases:

  1. A lead-in phase in which a lead-in trend line connecting the lows has a slope angle of about 30 degrees. Prices move in an orderly manner and the range of price oscillation defines the lead-in height between the lead-in trend line and the warning line which is parallel to the lead-in trend line.
  2. A bump phase where, after prices cross above the warning line, excessive speculation kicks in and the bump phase starts with fast rising prices following a sharp trend line slope with 45 degrees or more until prices reach a bump height with at least twice the lead-in height. Once the second parallel line gets crossed over, it serves as a sell line.
  3. A run phase in which prices break support from the lead-in trend line in a downhill run.

Gold - Spot Price

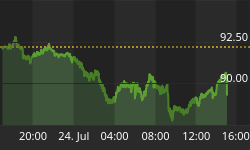
As the chart above shows the price of gold has breached the sell line at $1,830 so we can expect to see a correction with downside price targets for support as follows:

  1. $1,750 for support from the dotted pink line.
  2. $1,650 for support from the warning line.
  3. $1,500 for support from the lead-in trend line.


Original Source: http://fx5186.wordpress.com/speical-mid-week-update-8242011


Back to homepage

Leave a comment

Leave a comment