


Originally published September 24th, 2011.
In what turned out to be a devastating week for commodities, gold broke down from its intermediate top area and is now in full retreat. Both developments were accurately forecast in last week's Gold Market update and in other updates. clivemaund.com subscribers were positioned to make a fortune out of all this, and many did. After Friday's $77 breakdown move that saw gold smash decisively through the support at the lower boundary of the top area, what can we now expect?
You may recall that last week we pointed out that gold was looking considerably more resilient than silver, and that remains the case, especially as it is not so ardently pursued by "get rich quick" speculators as silver, who as we expected have been wiped out in just 2 days of trading. For this reason we had our eye on the 100-day moving average now at about $1634 as a provisional target area for the drop, but as we can see on gold's year-to-date chart below, it has already arrived at this downside target intraday on Friday. The ferocity of the decline, and especially the ferocity of the decline in other commodities such as copper and silver, which portend further heavy losses, requires us to have a rethink regarding gold's downside target.

The next port of call for gold looks like it is going to be the strong support shown on our chart not far above its 200-day moving average, and the bullish looking COT chart shown below suggests that gold may bottom somewhere near its 200-day moving average. Do not be fooled by the bullish looking COT however into thinking that it means a bottom is in - it was bullish last weekend and just look what happened afterwards - the bullish COT won't save gold when it is in the grip of a deflationary downwave, but the more bullish it looks the greater the chances of a reversal to the upside when the dust finally settles, and all the recent longs are lying face down in the dirt. Here we should point out that the copper charts in particular are calling for a devastating market crash similar to or worse than 2008, so we could see gold drop considerably below its 200-day moving average as in 2008, so we will have to see how things unfold going forward and be careful not to "jump the gun".

The dramatic collapse in copper last week was also predicted on the site and we capitalized on it by buying the leveraged copper bear ETF, HKD on the Toronto exchange, which has since broken out and soared. Copper is known as "Dr Copper" because it front runs developments in the economy and stockmarkets, as when demand for copper fades and lowers prices, it means recession is on the way, and this time round depression would be a more accurate term. The dramatic high volume collapse in copper last week is therefore regarded as the first thunderclap of a mighty storm that is about to envelop the global economy and is likely to involve a brutal crash in commodity and stockmarkets. With regards to copper itself this breakdown portends much lower prices to come. Codelco bosses take note - this is why the Chilean peso plunged last week.

The breakdown in the oil sector was also predicted in last weekend's Oil Market update. The oil sector has a lot further to fall.
It is amusing that some writers are still trying to pass off the dollar's big rally of recent weeks as a short-covering blip. As you may recall we predicted this rally days before it started. We never said that the dollar was intrinsically strong, but it stands to benefit big time from 2 major influences. One is that as the deflationary downwave crashes over global commodity and stockmarkets, vast torrents of cash fleeing in blind panic will rush to traditional safe havens like US Treasuries, partly because investors can't think of anything better to do, and partly as a reflex action and out of force of habit. To buy Treasuries you need dollars. Meanwhile the bickering discordant leaders of the "United States of Europe" are continuing to assiduously dig a huge crater for the euro to fall into, which is another reason the dollar should do well as the "King of Hell" - for as we know the euro is a very large constituent of the dollar index.

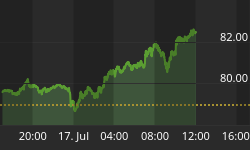
The resumption of the dollar's uptrend was also predicted last weekend as we can see on its year-to-date chart above, and while it is getting overbought on its MACD that is not expected to put the breaks on it much in the environment we are moving into.
A lot of hapless investors have been suckered into buying gold and silver stocks right at the top before last week's brutal plunge, fooled by the new highs in the HUI and GDX indices and others, and egged on by cheerleaders jumping around like Munchkins in the Wizard of Oz singing Follow the Yellow Brick Road, with one even describing the GDX chart as "The Breakout of the Decade Chart". We didn't buy it, because of the bearish volume patterns and various divergences, but also because the large stock XAU index DID NOT break out to new highs, as the 3-year chart below makes clear. Instead, as pointed out in the article The Gold Stock Earnings Trap and the Completing Tops in PM Stock Indices, which appeared on the site just before the PM sector caved in on Thursday, very bearish Broadening Tops were completing in both the HUI and XAU indices, which crashed dramatically on Thursday on Friday, action which points to imminent failure of these top area and an ongoing brutal plunge.

clivemaund.com subscribers are heavily positioned in bear ETFs and Puts, have been for a week or more, have already garnered massive profits, with one ZSL (bear silver ETF) Call up nearly 1000% and are sitting pretty, and don't have to do anything for a while except sit and watch the show.


