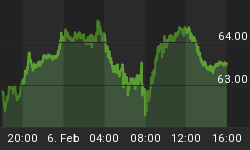
Looking purely at the Vix one could say it is moving down as fear comes out of the market. Equities are moving higher, Vix moving lower, all is coming back to normal. But if you look behind the Vix it is signaling a completely different picture.
What I see is something pulling back before a final assault and highly probable defeat of the 48.00 line in the sand. I see the Vix moving up to the 60 range in a matter of days. Perhaps that will lead to the final push lower in equities before some form of a tradable bottom is put in. Perhaps it is already in but judging by the divergence between volatility and the SPX I highly doubt it.
There are three charts I want to share with you below, all of which have commentary on them so please click and read what is written. As a refresher below are the various terms used on the charts.
Vix - measure of volatility or "fear" in the market.
Skew - measure of how implied volatility is "skewed" across the Vix versus a traditional bell curve. For example the more out of the money puts being purchased the higher the implied volatility on those options and thus a "skewed" implied volatility distribution across the Vix.
Divergence - the difference between the Skew and the Vix
IV Skew VS SPX

Divergence VS SPX

IV Skew VS Vix (inverted)


