


10/10/2011 9:19:41 AM
Often talked about, more often misunderstood.
Normally in market sell offs, when CNBC starts quoting 'The Vix', you know we're near a bottom, or a top.
And all this talk about 'it's different now', well guess what. It isn't.
This weekend I had one of my Stock Trading Secrets classes at a local school. The nice thing about the class, is that it's always changing with the markets. And this class was no different. The question of volatility came up. So I spent a little time discussing it. I'll cover that below and share a chart that I shared with the class.
As for the markets, stocks are up in the premarket, but futures wise, testing highs from Friday. Today will be a liquidity test. If market liquidity increases, the market should hold on to gains.
Be my guest at this year's World MoneyShow Chicago, October 20-22, 2011, at the Hilton Chicago Hotel. Don't miss out... register FREE and be sure to mention Priority code 023768! Click here to see more details about my session.
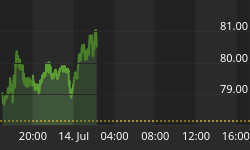
Here's a look at the global markets:

On the economic front, here is the schedule for this week. Pay close attention to the timing of the report and the potential for the markets to make short term reversals at those points.

On to the charts:

Stock Barometer Analysis
The barometer is in Buy Mode and we expect higher prices into the middle of this month (around the next options expiration).
There continues to be a significant amount of energy in the market for this rally to continue.
The Stock Barometer is my proprietary market timing system. The direction, slope and level of the Stock Barometer determine our outlook. For example, if the barometer line is moving down, we are in Sell Mode. A Buy or Sell Signal is triggered when the indicator clearly changes direction. Trend and support can override the barometer signals.
Money Management & Stops
To trade this system, there are a few things you need to know and address to control your risk:
- This system targets intermediate term moves, of which even in the best years, there are usually only up to 7 profitable intermediate term moves. The rest of the year will be consolidating moves where this system will experience small losses and gains that offset each other.
- This system will usually result in losing trades more than 50% of the time, even in our best years. The key is being positioned properly for longer term moves when they come.
- Therefore it is vitally important that you apply some form of money management to protect your capital.
- Trading a leveraged index fund will result in more risk, since you cannot set stops and you cannot get out intraday.
Accordingly;
- Make sure you set your stops so that you can lose no more than 2% per trade (based on the QQQQ if you're trading leveraged funds and options with our trading service).
Potential Cycle Reversal Dates
2011 Potential Reversal Dates: 1/15, 1/29, 2/16, 3/10, 3/18, 4/6, 5/21, 5/31, 6/13, 6/24, 7/16, 8/1, 8/19, 9/4, 9/25, 10/21, 10/25. We publish dates up to 2 months in advance.
We are in a seasonally strong period. We are at a 20 week cycle low, which has turned bullish. With a sell off into our 9/25 date, we expect a move higher into October 21.
As we get closer to these dates, I'll share the dates for the rest of the year. In addition, as we close in on 2012, I'll start doing my longer term forcasting. This usually results in a hand written chart that I hang in my office with a bunch of dates on it. Point is, you never know what cycle will dominate the market, but being aware of these dates as the market moves, can identify some key reversals. The dates we list here are just one of a series of about a dozen components we follow. But the most accurate over time.
My Additional timing work is based on numerous cycles and has resulted in the above potential reversal dates. These are not to be confused with the barometer signals or cycle times. However, due to their past accuracy I post the dates here.
2010 Potential Reversal Dates: 1/19, 1/28, 3/2, 3/23, 4/7, 5/30, 6/10, 6/28, 7/10, 8/13, 9/7, 10/2, 10/27, 11/21, 12/19. We publish dates up to 2 months in advance. 2009 Published Reversal Dates: 1/20, 2/11, 3/7, 3/15, 4/8, 4/16, 4/27, 5/7, 6/8, 7/2, 7/17, 9/14, 10/10, 10/24, 11/12, 11/30, 12/9, 12/21, 12/29. 2008 Potential Reversal Dates: 12/31, 1/11, 2/1, 2/13, 3/6, 4/5, 4/22, 5/23, 6/6, 6/27, 7/13, 9/2, 10/3, 10/22, 11/10, 12/11. 2007 Potential Reversal Dates: 1/10, 1/14, 1/27, 1/31, 2/3, 2/17, 3/10, 3/24, 4/21, 5/6, 6/15, 8/29, 10/19, 11/29, 12/13, 12/23, 12/31, 1/11/08. 2006 potential reversal dates: 1/16, 1/30, 2/25, 3/19, 4/8, 5/8, 5/19, 6/6(20), 7/24, 8/20, 8/29, 9/15, 10/11, 11/28. 2005 Potential reversal dates: 12/27, 1/25, 2/16, 3/4, 3/14, 3/29, 4/5, 4/19, 5/2, 6/3, 6/10, 7/13, 7/28, 8/12, 8/30-31, 9/22, 10/4, 11/15, 11/20, 12/16.
Timing Indicators
Use the following Timing/momentum indicators to assist in your trading of the QQQQ, GLD, USD, USO and TLT. They are tuned to deliver signals in line with the Stock Barometer and we use them only in determining our overall outlook for the market and for pinpointing market reversals. The level, direction, and position to the zero line are keys in these indicators. For example, direction determines mode and a buy signal 'above zero' is more bullish than a buy signal 'below zero'.
QQQQ Timing Indicator (NASDAQ:QQQQ)

The QQQQ Spread Indicator will yield its own buy and sell signals that may be different from the Stock Barometer. It's meant to give us an idea of the next turn in the market.
Gold Timing Indicator (AMEX:GLD)

Want to trade Gold? Use our signals with the Gold ETF AMEX:GLD. Gold gives us a general gage to the overall health of the US Economy and the markets.
US Dollar Index Timing Indicator (INDEX:DXY)

Want to trade the US Dollar? Use our signals with the Power Shares AMEX:UUP: US Dollar Index Bullish Fund and AMEX:UDN: US Dollar Index Bearish Fund.
Bonds Timing Indicator (AMEX:TLT)

Want to trade Bonds? Use our signals with Lehman?s 20 year ETF AMEX:TLT. The direction of bonds has an impact on the stock market. Normally, as bonds go down, stocks will go up and as bonds go up, stocks will go down.
OIL Timing Indicator (AMEX:USO)

Want to trade OIL? Use our signals with AMEX:USO, the OIL ETF. We look at the price of oil as its level and direction has an impact on the stock market.
Secondary Stock Market Timing Indicator

We daily monitor hundreds of popular and proprietary technical indicators that break down market internals, sentiment and money flow to give us unique insight into the market. We feature at least one here each day in support of our current outlook.
As an annual subscriber to any of our services, you will get access to all our charts and research. Email Carl@stockbarometer.com to upgrade and also save 20% on your subscription.
Daily Stock Market Outlook
We remain in Buy Mode here, expecting a bounce into mid October, around 10/18 to 10/21.
Above is a decade chart of 5 and 13 day moving averages of the vxo. I monitor both the vxo and the vix. Being old school, I still like the old vix (vxo) for historical perspective, but monitor the relationship between both simply because I'm a crazy data nut.
The CBOE recalculate the VIX back in September 2003. Since I record data every day in my data base, any changes to data I take pretty serious - since it can impact my barometer, which is basically a formula.
Big picture, the vix is similar to the market in that it can trend, channel, consolidate, etc. But not similar in that it's function is similar to a rubber band, where it can only stretch so far, before it's energy has to release. That energy release is one form of bullish market energy, or what I call potential energy.
The above chart of the VXO uses moving averages to show this behavior. We are not in a bearish positioning for volatility (trending). The relative level suggests we're at a level where the market can rally significantly. And has in the past. It's only one reason I'm bullish here.
Market moves have certain characteristics that I've mathmatically modeled. From my perspective, everything is setting up for a large move higher in the markets.
Does that mean I have to be right, right now? Certainly not, there is a random component to price action - to the extend that there is a random component to the batter facing a pitcher. Sure, certain pitch counts, outs, and runner positions on bases should give the intelligent batter some idea what to expect for a pitch. But at the end of the day, to the batter, there's a randomness in what to expect. And as a trader, like the batter, you position for the most likely move, and if you're babe ruth, you go for the magnitude move, more than the frequency move (i.e. if you swing at every pitch as if it will be a fast ball, eventually you'll be right and the result will be a home run, which he had quite a few - as well as quite a few strikeouts).
But what's different in baseball is that as the batter, there's almost always another pitch. Follow that strategy as a trader, and you'll soon find your capital may get depleted before you get another fast ball.
But I see this as a fast ball...
If you're looking for more information, please visit our blog - I'll have updates and publish other articles there. http://investmentresearchgroup.com/Blog/
Regards,


