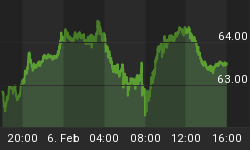
Monday's update page showed a 1 minute $TICK with large up and down gray bars. Most investors ignore this chart and data because it looks like nothing but noise.
But, if you look below at today's second and third chart, you will see how to convert this data into powerful trading data ...

This second chart is the very same one as the above chart, but with some very important changes. Notice the red, yellow, and green lines.
They are trend lines set in the following way:
The red line is a Smoothed Moving Average set at 10 ticks.
The yellow line is a Smoothed Moving Average set at 20 ticks.
The green line is a Smoothed Moving Average set at 80 ticks.
(Schwab's StreetSmart Pro is one trading platform where you can get Smoothed Moving Average capabilities.)
Note also, that there is a red and green horizontal line. These lines are set at zero and represent a Neutral line. So, above the lines is positive and below the lines is negative.
Yesterday, at 9:34 AM the red line went negative. At 9:53 AM, the yellow line followed and went negative. Both were below the (80 SmMA) green trend line with the green line trending lower at that time.
That was the trigger for a down movement and an intra-day shorting condition on Monday. At 3:01 PM, BOTH the red and yellow lines had moved above the horizontal line for a shift to a positive bias for the first time during the day ... which was an exit point on a short.

Our third chart shows the merging of the 1 minute $TICK chart with a 1 minute SPY chart so you can see the correlation.
To the right of the red vertical line was Monday's action. Note how the SPY went down when the Red and Yellow lines both went below the neutral lines at 9:53 AM yesterday. Thereafter, the SPY remained below its 80 minute Smoothed Moving Average all day, and it did so until the Red and Yellow TICK lines went above the horizontal neutral lines ... and that ended the short trade.
One indicator is good but having a second, confirming indicator is better. So, tomorrow, we will continue this session with the introduction of another indicator that is a key when using this data like this. See you tomorrow ...


