


Summary of Index Daily Closings for Week Ending December 3, 2004
| Date | DJIA | Transports | S&P | NASDAQ | Jun 30 Yr Treas Bonds |
| Nov 29 | 10475.90 | 3650.13 | 1178.57 | 2106.87 | 111^15 |
| Nov 30 | 10428.02 | 3658.71 | 1173.82 | 2096.81 | 110^04 |
| Dec 1 | 10590.22 | 3736.79 | 1191.37 | 2138.23 | 109^31 |
| Dec 2 | 10585.12 | 3729.94 | 1190.33 | 2143.57 | 109^21 |
| Dec 3 | 10592.21 | 3726.74 | 1191.17 | 2147.96 | 111^04 |
| SHORT TERM FORECAST (Next Two Weeks) | ||||
| TREND | PROBABILITY | Legend | ||
| Substantial Rise | Low | |||
| Market Rise | Medium | Very High | 80% | |
| Sideways | Medium | High | 60% | |
| Market Decline | High | Medium | 40% | |
| Substantial Decline | Medium | Low | 20% | |
| Very Low Under | 20% | |||
| INTERMEDIATE TERM FORECAST (Next 12 Weeks) | ||||
| TREND | PROBABILITY | Substantial | 800 points+ (DJIA) | |
| Substantial Rise | Low | Market Move | 200 to 800 points (DJIA) | |
| Market Rise | Medium | Sideways | Up or Down 200 (DJIA) | |
| Sideways | Medium | |||
| Market Decline | High | |||
| Substantial Decline | High | |||
The near-term top we've been calling for is taking a little more time than we expected, but is very close at hand. Our Short-term TII readings have spotted this top for a few weeks now, and once again the risk factors are high and our Short-term TII is warning of the high probability of a Market Decline - 200 to 800 points - starting any time now. Major tops take a little longer, so the top we're seeing may be of larger degree than some expect. A small Broadening Top "Megaphone" pattern has formed in the DJIA since early November. This week the Dow Jones Industrial Average closed up 69.98 points. Wednesday's 162 point buying panic was fueled, we were told, by oil's 7.4 percent one-day decline. But the next day, oil fell another whopping 4.9 percent and the Dow Industrials fell 5 points. So explaining stock market movement with oil price fluctuation is fallacious. The better explanation for the DJIA's behavior was the Elliott Wave count - a final thrust higher as part of a final wave five up. The financial media uses news to explain price movement but it is human psychology as measured by Technical Analysis that best explains price changes.
Coming Soon, in 2005, "Trader's Corner," a special feature for traders.
| Equities Markets Technical Indicator Index (TII) ™ | ||||
| Week Ended | Short Term Index | Intermediate Term Index | ||
| Aug 13, 2004 | (15.75) | (49.03) | Scale | |
| Aug 20, 2004 | 9.25 | (43.82) | ||
| Aug 27, 2004 | 9.25 | (39.81) | (100) to +100 | |
| Sep 3, 2004 | (39.25) | (40.06) | ||
| Sep 10, 2004 | (49.25) | (45.78) | (Negative) Bearish | |
| Sep 17, 2004 | (69.00) | (44.73) | Positive Bullish | |
| Sep 24, 2004 | (52.25) | (42.02) | ||
| Oct 1, 2004 | 25.50 | (37.23) | ||
| Oct 8, 2004 | (58.50) | (35.56) | ||
| Oct 15, 2004 | (24.50) | (35.48) | ||
| Oct 22, 2004 | (15.00) | (36.93) | ||
| Oct 29, 2004 | 39.50 | (40.06) | ||
| Nov 5, 2004 | 5.50 | (35.28) | ||
| Nov 12, 2004 | (6.50) | (27.63) | ||
| Nov 19, 2004 | (50.00) | (23.18) | ||
| Nov 26, 2004 | (54.25) | (26.88) | ||
| Dec 3, 2004 | (56.25) | (30.50) | ||
This week the Short-term Technical Indicator Index comes in at negative (56.25), indicating a decline is probable. This indicator is a useful predictor of equity market moves over the next two weeks, both as to direction and to a lesser extent strength of move. For example, readings near zero indicate narrow sideways moves are probable. Readings closer to +/-100 indicate with a higher degree of confidence that an impulsive move up or down is likely over the short run. Market conditions can change on a dime, or the Plunge Protection Team can come in and temporarily stop market slides, so it may be unwise to trade off this weekly measured indicator.
The Intermediate-term Technical Indicator Index is useful for monitoring what's over the horizon - over the next twelve weeks. It serves as an early warning system for unforeseen trend changes of considerable magnitude. This week the Intermediate-term TII comes in at negative (30.50).
Price divergences amongst major stock indices are an indication of potential trend reversals. At the very least, they mean something is seriously wrong with the trend in play. Quite often they signal an end to a secondary trend inside a larger primary trend. This week's Midweek report pointed out the divergence between the NASDAQ Composite and the NASDAQ 100 indices. The chart on the next page shows divergences between the Dow Industrials and the Dow Transportation Averages over the past five years. What is fascinating is that every single time their was a non-confirmation of one average by the other, a stock market crash followed shortly thereafter.
The chart shows that we have another flagrant divergence between these two averages right now. Both averages topped in early 2004. The Industrials topped on February 11th at 10,737.70. Since then, they have failed to exceed that level - and in fact remain 145.49 points under that hurdle. On the other hand, the Transports hit a top of 3,080.32 on January 22nd, 2004 and have since exceeded that hurdle by 656.47 points, or 21.3 percent. That is one long and nasty divergence and portends serious trouble for the equity rally that began back in October 2002.

Our two sentiment charts continue to warn of a significant correction. The first one on the next page, the SPX/VIX Ratio, records a 91.91 reading as of December 3rd, 2004. Major tops take a while to form, and by the looks of this chart (which covers this ratio going back to 1998), the pattern looks very similar to the pattern that formed at the 2000 all-time S&P 500 price peak. Since 1998, whenever this ratio has climbed to 68.00, a stock market crash followed starting almost immediately. The lone exception was in 1999 when a year-long warning of readings above 68.00 foretold the massive top to come in 2000. We have a similar situation again. Since late 2003 we have seen a yearlong series of readings above 68.00 without a crash. Our take on this is that - like 1999 - we are being forewarned of another major top, one that will be followed by a decline of perhaps as much as 30 to 50 percent. How can this be you ask? We believe this ratio's pattern is telling us that the start of the ominous Elliott Wave primary degree (3) down is about to begin. The SPX/VIX ratio peaked last week at the highest reading ever, at a similar reading to the peak reading in 2000 that kicked off an immediate decline that eventually took the S&P 500 down 50 percent over two years.
The second sentiment chart - a contrary indicator - is the 10 Day Average CBOE Call/Put Ratio. Consistent with the SPX/VIX's warning, the Call/Put Ratio has triggered a sell signal by dropping below its 1.40 topping threshold to 1.34 on December 3rd, 2004. Tops are indicated by readings above 1.40 and bottoms are indicated by readings below 1.00. Sell signals occur once the ratio declines back below 1.40, and buy signals occur once the ratio rises back above 1.00.


Bulls are frustrated that the Dow Industrials and other major indices failed to follow up on Wednesday's meteoric moment with another strong up day either Thursday or Friday. The reason they didn't get it was because we are in a Bear market. Bull markets get that sort of follow through. Except for Wednesday, the Dow fell 92 points this week. What we are seeing in the DJIA and most major averages is topping action. The key question is whether this is a minor top or a major top. If the DJIA fails to decline below 9,708 - October 25th's low - then we are in a minor top, but nearing a major top that should complete in early 2005. Should prices fall below 9,708, then we have wrapped up a major top, corrective primary degree wave (2) that started back in October 2002. The topping action we are seeing right now looks very similar to June 2004's topping action. That top took about 3 weeks to complete before a significant decline took prices to new lows in August 2004. Even Wednesday's big one-day wonder rally was similar to an isolated rally day back on June 7th, 2004. After that the DJIA could only muster another 88 point increase over the next two weeks, finally topping on June 23rd. Then a 665 point decline ensued.
The above chart (courtesy of www.stockcharts.com) shows an RSI that retreated from extreme overbought conditions and has returned there once again before correcting. RSI revisits to overbought territory before correcting to oversold levels is typical topping action. The MACD is rolling over from overbought levels last seen at a significant top - minor degree wave 3 back in February 2004. The Elliott Wave count we believe to be most accurate at this time is that we are completing a fivewave micro degree impulse with micro degree wave 5 very close to completion - minuette degree wave i up of a i-up, ii-down, iii-up, iv-down, v-up minor degree 5 to complete intermediate degree wave C up of primary degree (2) up. Next would be a multi-week correction - minuette degree ii down that would likely take prices to a Fibonacci retrace of i up. At present those possible downside targets would be 10,286 (.382), or 10,176 (.500 retrace), or 10,066 (.682), or 9,908 (.786). Under this scenario, it is possible that the entire final move up that completes primary degree (2) could finish around our next Fibonacci phi turn date of February 13th, 2005. However, there is another possibility - a much more Bearish scenario. That would be our alternate count which considers the impulse move up that is finishing any day now as one degree higher - as five minuette degree waves inside a final minor degree wave 5 of intermediate C of primary degree (2). If that is the case - if minor degree wave 5 is completing as a truncated 5th - a normal occurrence for a terminating secondary Bull move inside a primary Bear market - then we are merely days away from the start of a multi-year calamitous decline - Elliott Wave primary degree (3). Certainly record Bullish sentiment would argue for this alternate, more Bearish case. Again, the key to knowing which degree we are in is to see if the coming decline takes the DJIA below the October 25th 9,708 low. If it does, gang way below, primary degree wave (3) is upon us. If not, if one of the above Fibonacci retrace targets turns prices back up, then we have another two months or so of rally left.
The chart below compares the University of Michigan Consumer Sentiment Index with the Dow Industrials over the past six years. We see there is near-perfect correlation between these two indices. Interestingly, on occasion, the Michigan Index predicts the DJIA. This happened just before the DJIA plummeted in 2000. That time the Michigan index formed a Bearish Head & Shoulders top over a two year period from 1999 through 2000. It then declined sharply a few months before the DJIA followed. Again we see that from 2002 through now, the Michigan index has formed another Bearish Head & Shoulders top. Could this be forecasting a long-lasting sharp decline in the DJIA - perhaps the onslaught of Elliott Wave primary degree (3)?


The Dow Transportation Average has risen 25 percent since August 2004 without a correction - which meets the criteria for a Parabolic Spike. The PE for this index is over 90x. What we have here is a manic bubble. Parabolic Spikes do not have soft landings. Once the air comes out of this balloon, this index is going to crash and burn. It's been a nice ride for the trend-seeking hedge funds, but both the Elliott Wave count and the Rising Bearish Wedge pattern indicate the party is about over. Still, the Dow Transportation Average continues its ascension, one that never seems to reach an apex. Just when you think it has topped, it musters another hundred points and another new high, this time at 3748.05 intraday on Thursday December 2nd. This new high was of course unconfirmed by the Dow Industrials - a big problem under Dow Theory.
What's happening with the Rising Bearish Wedge pattern is that demand is being met with stronger and stronger supply as prices creep higher. The reversal will be confirmed once prices break below the bottom boundary line of the Wedge. There may be some back and forth as prices attempt to bust back above the Wedge, but this patterns - once broken down - becomes formidable resistance.
The RSI has been overbought for a while now - and can remain so - however it warns of the risk of a sharp reversal at any time. The MACD has once again turned up, but is also in overbought territory. This has become a greater fool's game. You buy because you know someone else will pay more. They buy because they know someone else will come along and pay more, which is the same motivation for that buyer. Its speculation pure and simple.

December 3rd's intraday top of 1,197 was very close to being a Fibonacci .786 of the S&P 500's all-time top of 1,553.09 intraday on March 24th, 2000. The exact price needed to get us there would be 1,220. As we mentioned in last week's issue, the Bullish Head & Shoulders pattern projects a rise to 1,220 - coincidently? This would make a good place for a primary degree wave (2) top. That would be because the primary degree wave (1) intraday bottom on October 10th, 2002 also came in at a common Fibonacci ratio of the same all time high - at .500, at 768.63. Some further interesting numbers here: October 10th, 2002 is 55 percent of the number of trading days between March 24, 2000's top and December 3rd, 2004's possible primary degree wave (2) top. Also, as of December 3rd, 2004, the S&P 500 has recovered 55 percent of the price decline between its March 24th, 2000 top and its October 10th 2002 bottom. 55 is a Fibonacci number (1, 1, 2, 3, 5, 8, 13, 21, 34, 55, etc...). Nothing guaranteed here, but time and price have converged to form some interesting Fibonacci relationships as of Friday December 3rd, 2004.
The S&P 500 hit another new higher high for the rally that started in October 2002, unconfirmed by the Dow Industrials. The intermediate-term picture is for this index to rally into a primary degree wave (2) top - a final minuette degree wave v up of minor degree wave 5 of intermediate degree wave C of primary degree wave (2). It is possible that top is occurring now. Or, it is possible that the minuette degree labeling of the waves since August 2004 shown above are one degree lower - implying that we are merely finishing up minuette degree i now - not minor degree 5, with a minuette degree ii correction about to commence, to be followed by iii up, iv down, and v up into mid-February 2005, which would be the final top for intermediate degree C and primary degree (2).

The chart on the next page (courtesy of www.stockcharts.com) shows two Bearish patterns in the S&P 500, a Broadening Top "Megaphone" and a Rising Bearish Wedge. There is also a Bullish Head & Shoulders Bottom, however prices have nearly fulfilled their upside target of 1,220, so we want to concentrate on what is most likely to be the next price determinant patterns.
Arguing for a final primary degree (2) top now is the Rising Bearish Wedge pattern which is commonly seen as a terminal pattern, a wave 5 of a final higher degree topping wave. The minimum downside target for this pattern is for prices to decline to the base of the pattern - in this case to 1,092. The equivalent move in the DJIA would be about a 1,000 point decline. A break below 1,060 would confirm the primary trend down has resumed.
Putting the brakes on any longer-term Bullish aspirations is a Bearish Broadening Top pattern, a "Megaphone." Here investors are becoming less and less certain what the correct valuation should be, shown by an increase in price volatility. The pattern shown above meets the requisite of at least two to three price swings that result in two to three lower lows and higher highs. This pattern was found in an MIT study by Dr. Andrew Lo of the Sloan School of Management to have a reliable outcome - in this case we expect a major reversal to the downside in a month or so, if not sooner.
The MACD is rolling over and the RSI is turning down from overbought levels last seen in January 2004, just prior to the start of minor degree wave 4's decline.
The Economy:
Lots of news this week, so here goes: According to the Institute for Supply Management, Manufacturing grew in November, up from 56.8 to 57.8. But putting the number in perspective, it was below the readings of the previous 11 months when ratings were in the 60s. Construction Spending in the private sector fell 0.3 percent, while government spending rose 1.2 percent in October according to the Commerce Department.
GDP was reported by the Commerce Department to have increased at a 3.9 percent annualized rate of growth during the third quarter 2004. Most of the increase came from Consumer Spending, and most of the Consumer Spending was on fuel. So no big deal. Adjusted for inflation, personal spending was down in October vs. September, and again most of that was on increased fuel costs. Yet this was spun by the news media (trying their level best to pump up their respective company's stock price - and their ratings) as one reason certain that stocks rallied sharply on Wednesday. Hmmm. Consumers spent more on fuel, so that's good? Hmmm. Here's some truth. Holiday shopping was not strong over the Thanksgiving weekend. Wal-Mart warned, and it took huge discounting to spur interest. Hey, even if sales were terrific, this stuff's being produced in China, not the U.S.A. How's that helping us? We borrow to buy their products. We have a systemic problem here with a pay-the-piper ending coming.
The Labor Department felt comfortable reporting a lower increase in Non-farm payroll Jobs for November - post election of course - announcing that gosh, we created 303,000 jobs in October but only 112,000 in November. My, what a difference a month makes. Don't expect Secretary Chao to be leaving any time soon. Jobless Claims shot back up to 349,000 for the week ended November 27th, according to the Labor Department.
The Federal Reserve leaked its intent to continue its policy of raising short-term interest rates in a speech by Philadelphia Fed President Santomero at the Philadelphia Fed's annual policy forum, according to a Reuters story reported on www.cnnmoney.com Friday. He mentioned "commitment to price stability" as the reason. Ha. That's funny. Very good. Nice sense of humor. Maybe he'll be hosting Saturday Night Live sometime soon. And who said regulators were dull. M-3 has grown from 6.57 trillion to 9.29 trillion - 41.4 percent - over the past five years. Why stop now?
And the sum of all this, and in spite of a wonderful equity rally from October 25th, the Conference Board announced its Index of Consumer Confidence dropped to 90.5 in November from October's 92.9 reading. Backing up that claim, the ABC/Money Consumer Confidence Index plummeted - one of the worst single-month drops in history - down five points to minus (-9) on a scale of minus (-100) to positive (+100). Our research shows that there is a pretty good correlation between these confidence readings and equity price movement.
Money Supply, the Dollar, & Gold:
M-3 rose 7.5 billion for the latest week reported, but M-3 remains 19.9 billion below its level back on June 18th. Our research indicates that whenever M-3 plateaus or declines for more than two months, a decline in the equity averages is supported.

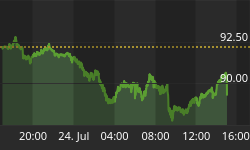
The trade-weighted U.S. Dollar tanked this week, as it tracks toward a primary degree Elliott Wave (1) bottom. It is in the latter stages of this quest, finishing off an intermediate degree wave 5 down of (1) down. Inside that wave, the Dollar has completed minuette degrees i through iv, and is wrapping up v down of minor degree 3. There should be a bit more decline followed by a small minor degree wave 4 rise and then one final descent to a bottom - minor degree 5 of intermediate degree 5 of Primary degree (1). Both the RSI and the MACD are oversold.
The entire decline to the primary degree (1) hit our minimum target of 82 that we projected back in June 2004 (see issue no. 61 in the archives of www.technicalindicatorindex.com) when the Dollar was trading at 89. We determined this from the Head & Shoulders Top pattern formed by intermediate degree Elliott Waves 4 and the first half of 5. This pattern confirmed with the decisive break below the neckline - below 87 - which increased the probability of the minimum downside target of 82 being reached. The Dollar has since slid below 81 and could fall further. The Elliott Wave count suggests the decline is not over, and based upon common relationships between waves, a target of 80 - our next support area - is not out of the question. Prices remain inside the long-term downtrend.
After a bottom is reached, look for a pretty strong A-B-C rally inside primary degree wave (2) that retraces a Fibonacci percent of primary (1) down's carnage - either .382, .500, .618, or .786. It is a rally that could consume a huge chunk of 2005. Then an awful primary degree wave (3) down. The Chart at the top of the next page gives the long-term Elliott Wave count we believe to be most accurate for the trade-weighted U.S. Dollar.


Gold (chart courtesy of www.stockcharts.com) continued its rise to a new rally high of 455.6 this week, the power of the Bullish Ascending Triangle providing the thrust. Inside this Bullish pattern is a smaller Bearish Rising Wedge pattern, complete with a "throw-over" that suggests a correction is coming. The Ascending Triangle projects an upside target of 500 before any significant correction. That target is arrived at by taking the distance of the widest part of the triangle and adding it to the spot of the breakout.
While Gold remains solidly inside its long-term rising trend-channel, there are some signs that a minor correction or breather is due. The RSI is overbought, as is the MACD, which looks like it is starting to curl over - a sign of slowing upside momentum.
The chart below shows that the HUI is in a long-term Bullish trend, but has started the latest corrective wave down. The top Elliott Wave count we've been showing the past several weeks required prices to decline from a minor degree B top - at 248.18 on November 17th, 2004 - and they have. The count we believe to be most accurate has prices declining into a minor degree wave C down of corrective intermediate degree wave 2 down that would likely take prices to a Fibonacci retrace of intermediate degree wave 1 up. If wave 2 is a flat - which I suspect given the strength of minor degree wave B - then the decline should stop in the neighborhood of minor degree wave A down - around the 170 area - about a Fibonacci .382 correction. Both the RSI and MACD have formed Head & Shoulders top patterns and prices have declined ten percent in response in less than a month. We have mapped out a possible price path based upon our Elliott Wave count.


U.S. Treasuries dropped sharply this week, through the neckline support of a small Head & Shoulders Top that has formed as part of the Right Shoulder of a much larger Head & Shoulders Top, confirming the smaller pattern - which increases the probability that a minimum downside target of 106.50 will be reached. Should prices break hard south, through the neckline of the larger pattern, then a minimum downside target of the low 80s would be in effect.
Looking at the Elliott Wave count that we believe to be most accurate at this time, minor degree wave c of intermediate degree wave 2 up completed at a Fibonacci .786 retrace of intermediate degree wave 1 - a common retrace point for wave 2s - at the Head of the small H&S pattern. Micro degree waves 1 and 2 have completed and 3 is underway of minuette degree i of minor degree 1 of intermediate degree 3 - a multi-month move. Both the RSI and the MACD have formed Rounded Bearish Top formations and are headed lower.
Bonds are one of the key problems for the Equity Secular or Intermediate-term Bull Market argument at this time. Bonds are at risk of decline just as equities try to fly, and ensuing rising interest rates will snuff out the fundamental earnings and spending necessary to fuel higher PEs. Bonds are a governor over equity irrational exuberance. Record U.S. Federal Budget, Trade, and Current Account deficits will keep pressure on the Dollar and that will also tend to push Bonds lower, keeping a lid on equities, and eventually - if not sooner - contributing to their next major decline.
Bottom Line: Insiders are dumping like there is no tomorrow. If management of public companies doesn't believe in the future prospects for their companies' stock prices, why should the investing public? Sentiment is at an extreme Bullish reading and is signaling a trend change is coming. Patterns are warning a top is close, as is the Elliott Wave count. Consumer confidence is down despite the recent rally, and fundamentals are flawed. You can chase this rally for the hope of another 5 percent, but risks are high that you either won't get them or will get them and then lose far more. Caution remains warranted.
"The Lord sustains all who fall,
And raises up all who are bowed down.
The eyes of all look to Thee,
And Thou dost give them their food in due time.
Thou dost open Thy hand,
And dost satisfy the desire of every living thing."
Psalm 145: 14 - 16
Coming Soon: In early 2005, we will be introducing a new feature for those who are interested in trading. Trader's Corner will document options trades only available on our website at www.technicalindicatorindex.com. Subscribers can contemporaneously follow our purchases and sales based upon what we believe to be high probability trading opportunities in the markets.
Special Note: Be sure to register under the subscribers' section at www.technicalindicatorindex.com for e-mail notifications and password access of our mid-week market analysis, usually available on Wednesdays or Thursdays. These midweek updates are only available via password access when posted on the web.
| Key Economic Statistics | ||||||||
| Date | VIX | Dec. U.S. $ | Euro | CRB | Gold | Silver | Crude Oil | 1 Week Avg. M-3 |
| 6/11/04 | 15.10 | 89.23 | 121.01 | 269.25 | 386.6 | 5.78 | 38.45 | 9265.9 b |
| 6/18/04 | 14.95 | 89.41 | 121.17 | 267.75 | 395.7 | 5.98 | 39.00 | 9305.7 b |
| 6/25/04 | 15.19 | 89.22 | 121.41 | 270.75 | 403.2 | 6.12 | 37.55 | 9296.2 b |
| 7/02/04 | 15.15 | 88.18 | 123.09 | 265.50 | 398.7 | 6.01 | 38.39 | 9327.7 b |
| 7/09/04 | 15.78 | 87.41 | 124.10 | 269.00 | 407.0 | 6.46 | 39.96 | 9273.9 b |
| 7/16/04 | 14.43 | 87.12 | 124.36 | 271.50 | 406.8 | 6.72 | 41.25 | 9238.8 b |
| 7/23/04 | 16.50 | 89.23 | 120.88 | 269.50 | 390.5 | 6.33 | 41.71 | 9259.9 b |
| 7/30/04 | 15.27 | 90.12 | 120.10 | 267.00 | 391.7 | 6.56 | 43.80 | 9272.3 b |
| 8/06/04 | 19.34 | 88.45 | 122.69 | 268.25 | 399.8 | 6.77 | 43.95 | 9267.9 b |
| 8/13/04 | 17.98 | 87.97 | 123.68 | 269.19 | 401.2 | 6.62 | 46.58 | 9250.2 b |
| 8/20/04 | 16.00 | 88.22 | 123.03 | 279.50 | 415.5 | 6.87 | 46.72 | 9261.9 b |
| 8/27/04 | 14.74 | 89.80 | 120.20 | 275.00 | 405.4 | 6.58 | 43.18 | 9298.6 b |
| 9/03/04 | 14.28 | 89.56 | 120.66 | 275.25 | 402.5 | 6.59 | 43.99 | 9288.3 b |
| 9/10/04 | 13.75 | 88.60 | 122.61 | 272.50 | 403.8 | 6.16 | 42.81 | 9280.6 b |
| 9/17/04 | 14.03 | 88.10 | 121.76 | 275.75 | 407.6 | 6.28 | 45.59 | 9275.1 b |
| 9/24/04 | 14.28 | 88.59 | 122.57 | 278.50 | 409.7 | 6.42 | 48.08 | 9319.8 b |
| 10/01/04 | 12.75 | 87.77 | 124.07 | 284.75 | 421.2 | 6.94 | 50.12 | 9335.6 b |
| 10/08/04 | 15.08 | 87.55 | 124.13 | 287.60 | 424.5 | 7.29 | 53.31 | 9295.3 b |
| 10/15/04 | 15.04 | 87.20 | 124.73 | 286.45 | 420.1 | 7.11 | 54.93 | 9260.1 b |
| 10/22/04 | 15.28 | 85.97 | 126.46 | 287.00 | 425.6 | 7.33 | 55.17 | 9281.1 b |
| 10/29/04 | 16.27 | 84.98 | 128.85 | 284.75 | 429.4 | 7.30 | 51.76 | 9297.7 b |
| 11/05/04 | 13.84 | 83.89 | 129.46 | 283.00 | 434.3 | 7.50 | 49.61 | 9302.8 b |
| 11/12/04 | 13.33 | 83.71 | 129.85 | 283.50 | 438.8 | 7.62 | 47.32 | 9300.2 b |
| 11/19/04 | 13.50 | 83.32 | 130.13 | 287.25 | 447.0 | 7.60 | 48.44 | 9292.8 b |
| 11/26/04 | 12.78 | 81.81 | 132.93 | 288.75 | 449.5 | 7.59 | 49.44 | 9299.9 b |
| 12/03/04 | 12.96 | 80.98 | 134.53 | 284.75 | 456.0 | 7.99 | 42.54 | - |
Note: Dollar and Oil plummet; Euro, Gold, & Silver catapult.


