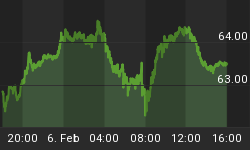
One of the things we do every night, is run a computer scan on the S&P 500 stocks and actually measure what the Strength level was for each one. From that computer run, we calculate how many of the 500 S&P stocks had Positive Strength and how many had Negative Strength.
The results gives you a picture of how the Bulls and Bears are doing against each other.
So, here is last night's chart ... A quick look at it and you will see that there are many more stocks in a bullish condition relative to the number of stocks in a bearish condition. So, the new positive bias that started on October 10th, remains in place. (This chart is updated every day, and can be found on Section 4, Chart 1 of the Standard subscriber site.)


