• 657 days Will The ECB Continue To Hike Rates?
  • 658 days Forbes: Aramco Remains Largest Company In The Middle East
  • 659 days Caltech Scientists Succesfully Beam Back Solar Power From Space
  • 1,059 days Could Crypto Overtake Traditional Investment?
  • 1,064 days Americans Still Quitting Jobs At Record Pace
  • 1,066 days FinTech Startups Tapping VC Money for ‘Immigrant Banking’
  • 1,069 days Is The Dollar Too Strong?
  • 1,069 days Big Tech Disappoints Investors on Earnings Calls
  • 1,070 days Fear And Celebration On Twitter as Musk Takes The Reins
  • 1,072 days China Is Quietly Trying To Distance Itself From Russia
  • 1,072 days Tech and Internet Giants’ Earnings In Focus After Netflix’s Stinker
  • 1,076 days Crypto Investors Won Big In 2021
  • 1,076 days The ‘Metaverse’ Economy Could be Worth $13 Trillion By 2030
  • 1,077 days Food Prices Are Skyrocketing As Putin’s War Persists
  • 1,079 days Pentagon Resignations Illustrate Our ‘Commercial’ Defense Dilemma
  • 1,080 days US Banks Shrug off Nearly $15 Billion In Russian Write-Offs
  • 1,083 days Cannabis Stocks in Holding Pattern Despite Positive Momentum
  • 1,084 days Is Musk A Bastion Of Free Speech Or Will His Absolutist Stance Backfire?
  • 1,084 days Two ETFs That Could Hedge Against Extreme Market Volatility
  • 1,086 days Are NFTs About To Take Over Gaming?
What's Behind The Global EV Sales Slowdown?

What's Behind The Global EV Sales Slowdown?

An economic slowdown in many…

How The Ultra-Wealthy Are Using Art To Dodge Taxes

How The Ultra-Wealthy Are Using Art To Dodge Taxes

More freeports open around the…

Another Retail Giant Bites The Dust

Another Retail Giant Bites The Dust

Forever 21 filed for Chapter…

  1. Home
  2. Markets
  3. Other

Going Old School

I know this stuff doesn't mean anything until it does, but did anybody happen to notice that the market's climb over the past 5 days has been on declining volume?

Figure 1 is a daily chart of the S&P Depository Receipts (symbol: SPY) with volume bars in the lower panel. The red and gold dots over the price bars are key pivot levels or the best areas of support (buying) and resistance (selling). Looking to the volume bars, we note a spike in volume on a gap down day (at point #1). Over the next 5 days, the market climbed back to resistance levels, but it was on declining volume. Coupled this with the fact that investors have begun to see the market as bulletproof (Rydex asset data; see Daily Sentiment Report), it is clear from this perspective that the best gains from this rally are behind us. We are playing for scraps.

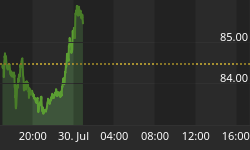
Figure 1. SPY/ daily
SPY Daily
Larger Image

Old school stuff -- volume, support and resistance -- are still important, but it is often overlooked by those who trade and invest on emotion.


Back to homepage

Leave a comment

Leave a comment