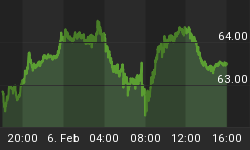
The intraday (price based) setup looking for another strong intraday run-up in the markets on Friday, November 11 (see Implications of a Black Candle Today) played out nicely again (although due to a gap up at the open an entry opportunity was not presented), while the seasonal intraday setup looking for the markets trading below the previous session's close at least once on Verterans Day failed for the first time since 1990 (and may be for an even longer period of time, but my analysis started in 1990).
The S&P 500 closed up +0.85% on the week and is up as well+0.84% month-to-date, +11.70% quarter-to-date, and +0.49% year-to-date.
With Veterans Day behind us, we're entering into the favorable year-end seasonality. Table I below shows all historical occurrences (since 1930), the SPX's (S&P 500) performance over the remainder of the year ('Quarterly Returns'), the number of days invested, the maximum run-up and the maximum drawdown during the period under review, assumed one went long on close of Veterans Day, or the session immediately before in the event the NYSE had been closed on November 11 (closed all day in 1918, 1921, 1934-1953, or it had been a Saturday or Sunday), and went back into cash on close of the last session of the respective year.

The S&P 500 closed at a higher level (compared to the close on Veterans Day) in all of the last 10 (even during the bear market at the start of this decade, and even during the financial crisis in 2007/2008), 22 out of the last 24 and 56 out of the last 81 years (since 1930). In addition, the S&P 500 posted at least one higher close above the close on Veterans Day in all years (!), but never looked back and did not post a single close below the close on Veterans Day in 5 years.
Now lets take at look on those occurrences where the S&P 500 was already up year-to-date on the close of Veterans Day. Table I below shows all historical occurrences (since 1930), the SPX's (S&P 500) performance over the remainder of the year ('Quarterly Returns'), the number of days invested, the maximum run-up and the maximum drawdown during the period under review, assumed one went long on close of Veterans Day, or the session immediately before in the event the NYSE had been closed on November 11 (closed all day in 1918, 1921, 1934-1953, or it had been a Saturday or Sunday), - always assumed the S&P 500 was up year-to-date on the close of the respective session -, and went back into cash on close of the last session of the respective year.

The S&P 500 closed at a higher level (in comparison to Veterans Day) in all of the last 17 and 42 out of a total of 51 occurrences (since 1930), or more than 80% of the time. And even when the buy setup failed, downside potential was regularly limited - if any. The S&P 500 closed lower -1.0%+ at the end of the year on only 3 out of 51 occurrences (and was never down more than -3.58% at the end of the year), but up 1.0%+ on 38 occurrences (for an impressive 13 : 1 ration on 1.0% changes on the up- vs. downside), thereof up 3.0%+ on 24 occurrences or almost 50% of the time.
Conclusion(s): With Veterans Day behind us, we're entering into the favorable year-end seasonality, and historically it had been even more favorable in the event the S&P 500 was (already) up year-to-date on the close of Veterans Day. Any short-term consolidation of the market's recent gains right at the beginning of next week might provide a favorable buying opportunity for those with an intermediate term investment horizon (until the end of the year).
And please keep in mind:
There're still a couple of setups in play triggered a couple of month ago, calling for the S&P 500 closing out 2011 with a gain (Will Too Many Bulls Really Make a Bear?, A Perfect (Bullish) Score, if ... , The Third Year of the Presidential Cycle).
Successful trading,


