


11/30/2011 9:26:21 AM
A lesson learned early on, still holds some weight.
It's important to understand the volatility component of trading. It works both ways. So as volatility increases, so to does the potential to move a certain amount in either direction (it's not just one directional).
So while most view volatility as bearish, I view it as bullish in my contrarian ways.
That being said, you then have to look at the likely direction of volatility. For that, we have the following indicator:

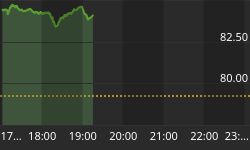
Today gives us a second gap. Depending on how the market handls the gap, we could be in a 3 gap play. I'll be watching for it tomorrow...
Here's a look at the global markets:

On the economic front, here is the schedule for this week. Pay close attention to the timing of the report and the potential for the markets to make short term reversals at those points.

On to the charts:

Stock Barometer Analysis
We remain in Buy Mode here, expecting the markets to bottom and run higher into Mid December. We've got the initial bounce; now it looks as though we have a V-Bottom forming. The move will be quick and leave most behind...
The Stock Barometer is my proprietary market timing system. The direction, slope and level of the Stock Barometer determine our outlook. For example, if the barometer line is moving down, we are in Sell Mode. A Buy or Sell Signal is triggered when the indicator clearly changes direction. Trend and support can override the barometer signals.
Money Management & Stops
To trade this system, there are a few things you need to know and address to control your risk:
- This system targets intermediate term moves, of which even in the best years, there are usually only up to 7 profitable intermediate term moves. The rest of the year will be consolidating moves where this system will experience small losses and gains that offset each other.
- This system will usually result in losing trades more than 50% of the time, even in our best years. The key is being positioned properly for longer term moves when they come.
- Therefore it is vitally important that you apply some form of money management to protect your capital.
- Trading a leveraged index fund will result in more risk, since you cannot set stops and you cannot get out intraday.
Accordingly;
- Make sure you set your stops so that you can lose no more than 2% per trade (based on the QQQQ if you're trading leveraged funds and options with our trading service).
Potential Cycle Reversal Dates
2011 Potential Reversal Dates: 1/15, 1/29, 2/16, 3/10, 3/18, 4/6, 5/21, 5/31, 6/13, 6/24, 7/16, 8/1, 8/19, 9/4, 9/25, 10/21, 10/25, 11/25, 12/26. We publish dates up to 2 months in advance.
It looks as though we have a 11/25 low confirmed - and I expect a move higher into 12/26.
My Additional timing work is based on numerous cycles and has resulted in the above potential reversal dates. These are not to be confused with the barometer signals or cycle times. However, due to their past accuracy I post the dates here.
2010 Potential Reversal Dates: 1/19, 1/28, 3/2, 3/23, 4/7, 5/30, 6/10, 6/28, 7/10, 8/13, 9/7, 10/2, 10/27, 11/21, 12/19. We publish dates up to 2 months in advance. 2009 Published Reversal Dates: 1/20, 2/11, 3/7, 3/15, 4/8, 4/16, 4/27, 5/7, 6/8, 7/2, 7/17, 9/14, 10/10, 10/24, 11/12, 11/30, 12/9, 12/21, 12/29. 2008 Potential Reversal Dates: 12/31, 1/11, 2/1, 2/13, 3/6, 4/5, 4/22, 5/23, 6/6, 6/27, 7/13, 9/2, 10/3, 10/22, 11/10, 12/11. 2007 Potential Reversal Dates: 1/10, 1/14, 1/27, 1/31, 2/3, 2/17, 3/10, 3/24, 4/21, 5/6, 6/15, 8/29, 10/19, 11/29, 12/13, 12/23, 12/31, 1/11/08. 2006 potential reversal dates: 1/16, 1/30, 2/25, 3/19, 4/8, 5/8, 5/19, 6/6(20), 7/24, 8/20, 8/29, 9/15, 10/11, 11/28. 2005 Potential reversal dates: 12/27, 1/25, 2/16, 3/4, 3/14, 3/29, 4/5, 4/19, 5/2, 6/3, 6/10, 7/13, 7/28, 8/12, 8/30-31, 9/22, 10/4, 11/15, 11/20, 12/16.
Timing Indicators
Use the following Timing/momentum indicators to assist in your trading of the QQQQ, GLD, USD, USO and TLT. They are tuned to deliver signals in line with the Stock Barometer and we use them only in determining our overall outlook for the market and for pinpointing market reversals. The level, direction, and position to the zero line are keys in these indicators. For example, direction determines mode and a buy signal 'above zero' is more bullish than a buy signal 'below zero'.
QQQQ Timing Indicator (NASDAQ:QQQQ)

The QQQQ Spread Indicator will yield its own buy and sell signals that may be different from the Stock Barometer. It's meant to give us an idea of the next turn in the market.
Gold Timing Indicator (AMEX:GLD)

Want to trade Gold? Use our signals with the Gold ETF AMEX:GLD. Gold gives us a general gage to the overall health of the US Economy and the markets.
US Dollar Index Timing Indicator (INDEX:DXY)

Want to trade the US Dollar? Use our signals with the Power Shares AMEX:UUP: US Dollar Index Bullish Fund and AMEX:UDN: US Dollar Index Bearish Fund.
Bonds Timing Indicator (AMEX:TLT)

Want to trade Bonds? Use our signals with Lehman?s 20 year ETF AMEX:TLT. The direction of bonds has an impact on the stock market. Normally, as bonds go down, stocks will go up and as bonds go up, stocks will go down.
OIL Timing Indicator (AMEX:USO)

Want to trade OIL? Use our signals with AMEX:USO, the OIL ETF. We look at the price of oil as its level and direction has an impact on the stock market.
Secondary Stock Market Timing Indicator

We daily monitor hundreds of popular and proprietary technical indicators that break down market internals, sentiment and money flow to give us unique insight into the market. We feature at least one here each day in support of our current outlook.
As an annual subscriber to any of our services, you will get access to all our charts and research. Email Carl@stockbarometer.com to upgrade and also save 20% on your subscription.
Daily Stock Market Outlook
We remain in Buy Mode, seeing the markets bottom here and rally into Mid to late December.
Above chart shows the level of individual in the market. Once this peaks out, I expect the market to top. We're by no means near there yet...
Our QQQ options position is up almost 40%. I made several call options plays yesterday in our SOS service. They should be cranking today! As a heads up, our Stock Options Speculator service will return to regular pricing $39/month) in 2012. Click here to take advantage of the discounted pricing ($9.95/month) for the remainder of 2011 - and that will lock in the discounted pricing as long as you remain subscribed... I also put 10 of these option plays up on the blog.
If you want to learn more about some of these indicators, I use my blog to cover them in more detail.
If you're looking for more information, please visit our blog - I'll have updates and publish other articles there. http://investmentresearchgroup.com/Blog/
Regards,


