• 1,062 days Will The ECB Continue To Hike Rates?
  • 1,063 days Forbes: Aramco Remains Largest Company In The Middle East
  • 1,064 days Caltech Scientists Succesfully Beam Back Solar Power From Space
  • 1,464 days Could Crypto Overtake Traditional Investment?
  • 1,469 days Americans Still Quitting Jobs At Record Pace
  • 1,471 days FinTech Startups Tapping VC Money for ‘Immigrant Banking’
  • 1,474 days Is The Dollar Too Strong?
  • 1,474 days Big Tech Disappoints Investors on Earnings Calls
  • 1,475 days Fear And Celebration On Twitter as Musk Takes The Reins
  • 1,477 days China Is Quietly Trying To Distance Itself From Russia
  • 1,477 days Tech and Internet Giants’ Earnings In Focus After Netflix’s Stinker
  • 1,481 days Crypto Investors Won Big In 2021
  • 1,481 days The ‘Metaverse’ Economy Could be Worth $13 Trillion By 2030
  • 1,482 days Food Prices Are Skyrocketing As Putin’s War Persists
  • 1,484 days Pentagon Resignations Illustrate Our ‘Commercial’ Defense Dilemma
  • 1,485 days US Banks Shrug off Nearly $15 Billion In Russian Write-Offs
  • 1,488 days Cannabis Stocks in Holding Pattern Despite Positive Momentum
  • 1,489 days Is Musk A Bastion Of Free Speech Or Will His Absolutist Stance Backfire?
  • 1,489 days Two ETFs That Could Hedge Against Extreme Market Volatility
  • 1,491 days Are NFTs About To Take Over Gaming?
Is The Bull Market On Its Last Legs?

Is The Bull Market On Its Last Legs?

This aging bull market may…

How The Ultra-Wealthy Are Using Art To Dodge Taxes

How The Ultra-Wealthy Are Using Art To Dodge Taxes

More freeports open around the…

Another Retail Giant Bites The Dust

Another Retail Giant Bites The Dust

Forever 21 filed for Chapter…

  1. Home
  2. Markets
  3. Other

TLT: Likely Double Top

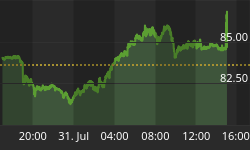
Figure 1 is a weekly chart of the i-Shares Lehman 20 plus Year Treasury Bond Fund (symbol: TLT).

Figure 1. TLT/ weekly
TLT Weekly Chart
Larger Image

Last week, in the article on "Bond Technicals", I provided some signposts to help guide us with the price action. As far as TLT was concerned, I stated: "It seems likely that TLT will end the week above the most immediate pivot at 120.76. If TLT can stay above this level, it should surpass the 2008 highs." TLT did end the week at 120.80, which was above the key pivot, but with this week's risk on bonanza, it seems very likely that TLT will close the week back below this key level. By my definition, this would be the dreaded double top.

Of course, last week when I wrote the article "Bond Technicals", it did appear that TLT would easily close above the key pivot by week's end; it ended the week only 4 cents above that level. Currently, we are 2.5 points below the key pivot. My point is that anything can happen, and as I operate on weekly data, I will need to wait until Friday's close to get confirmation.

As far as the fundamental model, it still remains positive, but I will need to wait until the end of the week to make that call. As always, I will keep you posted.


Back to homepage

Leave a comment

Leave a comment