


In my last report a few days back, I spoke of the 1208ES area, it held for now, but the lack of upside is slightly troubling and with no real help from other risk markets, the markets appear to be still stuck in bleed mode, and stair stepping lower.
A couple of times we have bought into the lows on the end of the trading day and in globex looking for a surprise upside move, although we are getting 20 handle rallies, the bounces are still not seeing enough upside movement to suggest a low in place.
Although the decline is far from impulsive, the sideways movement is suggesting that we are in a range and one I suspect is going to last a while longer.
So traders are going to need to adjust for the next few months.
So whilst it continues, the trend for now is down short term and remains so under Friday's lows, we had 1226ES penciled as our bear/bull area. Friday it came right back into the area but failed, so once again we were sellers of risk.
Being a seller of risk opens the door to many markets, some traders can sell the ES others AUD/USD or EUR/USD etc or even GBP/USD as that pair has now joined into the party.
The risk trade still lives on and those that are watching patterns involve in the FX risk pairs are clearly having an edge on this market atm. We got some great ideas on the USD/CAD pair which we believe will have an effect with the ES/SPX markets over the coming weeks ahead.
Using our levels has saved us from getting too bearish and bullish.
We had some key areas on the upside that were tested on Friday but failed to break out, so that leaves us back in bear mode, although we have been switching in/out of bias this week due to the nature of the swings.
If traders are not interested in this sort of price action, then my advice is to close down your stations and walk away until the New Year or wait for something to setup.
We are in a huge range or around 150 handles, and traders need to accept this as the new normal until you get a solid move away from this area, although I think it's a great range and throwing up chances regularly, we can usually find 3-4 ideas a week sometimes more, with a market like that you don't need it to trend.
SPX
In this sort of tape, using other techniques carry their weight just as much as using Elliott Wave Theory, when there are times of confusion, I simply move back to using fractals as they carry some importance in my work.
The markets are in a transition phase where they are trying to find their footing, you can clearly see that over the past 3 months, all we have done is create havoc for biased traders who are hell bent on committing to one side but not respecting what the tape is doing.
You can also see on this chart the stair stepping we are involved in; 2 weeks ago you saw exactly the same just before the rally from the World Bank stick save scheme news.

Just looking at that chart tells you enough information to find a trade, when you see 3 wave bounces, and the trend is down, those are corrective against the trend.
If you look at the fractals you can see how similar they are in length to Fridays bounce, and using the longest fractal you can clearly see that until you break above that mark, (upper red mark) the market is in sell the rallies mode.
Not until its back above Friday high, could we think a low is in place, although we are working some ideas that could do with a little bit lower in price, and then potentially find a low.
However we will respect any aggressive reversal above Fridays high.

Again, you can see how it's being held via these trend lines, so the trend is clearly stuck in bleed mode, hence the times it tries to bounce its leaving a bounce that is similar in DNA to the previous rallies.
I noticed something strange on the end to Friday's price action, the RSI starting to hook, but as I posted the same chart a few days back there is not much to update.
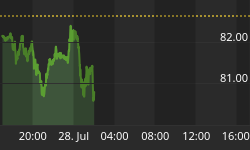
1208ES continues to be a key area, that's approx 1214SPX

It's only just below the 50 mark on the daily RSI.
Nyse McClellan Osc
You can see on the Nyse McClellan Osc, I suspect it's a hidden divergence, as the technical's are not supporting a heavy decline, and suggest what I think is a corrective decline, only it seems to want to wear traders out by time, hence the bleed mode, but using the previous fractals and watching for 3 wave bounces are keep us on the right side on the tape this week. Using our areas, we are still looking lower as against Friday's highs.

DAX
You can see the same sort of bleed and a tape that is stuck in a channel, until you break to the upside in a strong move, the bleed continues, you don't need to use Elliott Wave for this sort of tape, using other techniques make the job easier to stay with the current trend till price action confirms a reversal.

Gold
With the heavy price action we saw the past few days, it was clear too many were trading the triangle pattern, I saw that written in many publications, and it's clear that I think many were surprised by the heavy decline.
I wrote about gold back in August this year about a top, although from the email response I received it was clear that it was not welcomed, I guess going against the herd at key inflection points, takes a belief in his/her work, my work was suggesting that an impending high was near on gold. That analysis proved to be correct, gold did indeed find a short term high, and I only hope some took some profits off the table, as loosing 20% is not to be sniffed at.
It's now that I am starting to like the bullish side of gold, as I think it could be near to a great buying opportunity.
Do you notice something here? I am bearish at the highs when everyone wants to buy gold, yet now after its crash 20% I want to be a buyer or at least consider it.
That's how you make $$$, you buy at the lows of a move and sell at the highs.
Now with this latest heavy sell off, I suspect many will be shying away from buying and those that are trapped at higher prices are not exactly feeling good about themselves.
Joining into the euphoria of a blow off is a classic way to lose $$$, history tells you this, and why did anyone think that blow off in gold was going to be any different? No one sees it coming till it's too late.
All blows offs end in tears, history has proven it time and time again.
Silver at nearly $50 this year, no one wanted to believe it could crash, yet I wrote about that as well, and price was suggesting far lower, here we are at nearly $30.
It seems traders still fall for the seduction of greed, they are comfortable buying into everyone else's opinions yet they don't consider the other side of the trade till it's too late.

I don't actually consider the price action of gold to be bearish as some are vocal about, in fact I think it could be on a potential setup soon to buy, if not at these prices then a little under $1500 towards the long term trend line.
Already the RSI has hit the buy zone, only we don't yet have enough price action to suggest a low could be in place, so going to keep the option open for a move towards $1500 to take out the stops at $1532.
The risk is small for any of these ideas, but once we have some price action to work with then I think it will offer a great trade.
Only a substantial break of $1400 would I really consider the bulls are in trouble, but when I see and read the bears finally coming out at the lows on a potential bottom, that's the time I consider stepping up if a setup is clear enough to warrant buying.
Now ask yourself the question where do you want to buy? At $1850 when I suggested sell gold and get out and lock in the gains, or near $1500?
Conclusion
Us markets are in a state of confusion, for me to post the 5 working ideas would take up many pages, and only confuse readers, we are working some ideas, but moving down to short term time frames until we find some clarity, traders will need to adjust to this environment, as I think it's going to be around for a while longer.
It's time to look at other markets to see it chances arise, we have found some great setups in FX recently, so chances are still coming for the traders that are doing their homework.
Until next time.
Have a profitable week ahead.


