


12/27/2011 9:12:01 AM
Will it be a happy holiday season for the stock market?
First off, let me just say happy holidays! It's a great time of year to reflect on the past and look forward to the future. 2012 looks to be a great year. With the election and all, many will attribute stock action to the markets expectations for the election. That's where most will be focusing.
I also took a few minutes to go through the past 12 years of charts to look at the January Effect. Visit our blog here to see our conclusions. The January Effect
I apologize for not getting the article out last Friday. I was done with the images, but then I got burried in a new data base I'm working on analyzing some deeper relationships in the market that we can use to improve our forecasting - also some focus work on OIL. As longer term macro themes begin to play out, it'll be nice to grab a few of them over the year.
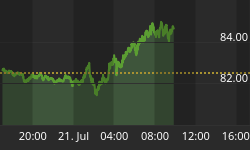
Here's a look at the global markets:

On the economic front, here is the schedule for this week. Pay close attention to the timing of the report and the potential for the markets to make short term reversals at those points.

On to the charts:

Stock Barometer Analysis
The barometer remains in Buy Mode. We're at key levels across all indices. We're also at a key reversal date. This time of year is difficult to call as it can run higher and continue farther than anyone expects. But the market has been unable to break out of these levels for some time. I'd take precautions here. But not go into Sell Mode until we get a confirmed signal. It's a lower volatility envirnment - so the market will not run as much as in the past few weeks.
The Stock Barometer is my proprietary market timing system. The direction, slope and level of the Stock Barometer determine our outlook. For example, if the barometer line is moving down, we are in Sell Mode. A Buy or Sell Signal is triggered when the indicator clearly changes direction. Trend and support can override the barometer signals.
Money Management & Stops
To trade this system, there are a few things you need to know and address to control your risk:
• This system targets intermediate term moves, of which even in the best years, there are usually only up to 7 profitable intermediate term moves. The rest of the year will be consolidating moves where this system will experience small losses and gains that offset each other.
• This system will usually result in losing trades more than 50% of the time, even in our best years. The key is being positioned properly for longer term moves when they come.
• Therefore it is vitally important that you apply some form of money management to protect your capital.
• Trading a leveraged index fund will result in more risk, since you cannot set stops and you cannot get out intraday.
Accordingly;
• Make sure you set your stops so that you can lose no more than 2% per trade (based on the QQQQ if you're trading leveraged funds and options with our trading service).
Potential Cycle Reversal Dates
2011 Potential Reversal Dates: 1/15, 1/29, 2/16, 3/10, 3/18, 4/6, 5/21, 5/31, 6/13, 6/24, 7/16, 8/1, 8/19, 9/4, 9/25, 10/21, 10/25, 11/25, 12/26. We publish dates up to 2 months in advance.
The markets moved higher into our next key reversal date of 12/26. That would suggest that the next key reversal date, 1/12 - is critical. Generally, I would be bullish into 1/12 due to seasonal factors and the January Effect. I'm still leaning that way unless we get a sell signal. So stay tuned.
My Additional timing work is based on numerous cycles and has resulted in the above potential reversal dates. These are not to be confused with the barometer signals or cycle times. However, due to their past accuracy I post the dates here.
2010 Potential Reversal Dates: 1/19, 1/28, 3/2, 3/23, 4/7, 5/30, 6/10, 6/28, 7/10, 8/13, 9/7, 10/2, 10/27, 11/21, 12/19. We publish dates up to 2 months in advance. 2009 Published Reversal Dates: 1/20, 2/11, 3/7, 3/15, 4/8, 4/16, 4/27, 5/7, 6/8, 7/2, 7/17, 9/14, 10/10, 10/24, 11/12, 11/30, 12/9, 12/21, 12/29. 2008 Potential Reversal Dates: 12/31, 1/11, 2/1, 2/13, 3/6, 4/5, 4/22, 5/23, 6/6, 6/27, 7/13, 9/2, 10/3, 10/22, 11/10, 12/11. 2007 Potential Reversal Dates: 1/10, 1/14, 1/27, 1/31, 2/3, 2/17, 3/10, 3/24, 4/21, 5/6, 6/15, 8/29, 10/19, 11/29, 12/13, 12/23, 12/31, 1/11/08. 2006 potential reversal dates: 1/16, 1/30, 2/25, 3/19, 4/8, 5/8, 5/19, 6/6(20), 7/24, 8/20, 8/29, 9/15, 10/11, 11/28. 2005 Potential reversal dates: 12/27, 1/25, 2/16, 3/4, 3/14, 3/29, 4/5, 4/19, 5/2, 6/3, 6/10, 7/13, 7/28, 8/12, 8/30-31, 9/22, 10/4, 11/15, 11/20, 12/16.
Timing Indicators
Use the following Timing/momentum indicators to assist in your trading of the QQQQ, GLD, USD, USO and TLT. They are tuned to deliver signals in line with the Stock Barometer and we use them only in determining our overall outlook for the market and for pinpointing market reversals. The level, direction, and position to the zero line are keys in these indicators. For example, direction determines mode and a buy signal 'above zero' is more bullish than a buy signal 'below zero'.
QQQQ Timing Indicator (NASDAQ:QQQQ)

The QQQQ Spread Indicator will yield its own buy and sell signals that may be different from the Stock Barometer. It's meant to give us an idea of the next turn in the market.
Gold Timing Indicator (AMEX:GLD)

Want to trade Gold? Use our signals with the Gold ETF AMEX:GLD. Gold gives us a general gage to the overall health of the US Economy and the markets.
US Dollar Index Timing Indicator (INDEX:DXY)

Want to trade the US Dollar? Use our signals with the Power Shares AMEX:UUP: US Dollar Index Bullish Fund and AMEX:UDN: US Dollar Index Bearish Fund.
Bonds Timing Indicator (AMEX:TLT)

Want to trade Bonds? Use our signals with Lehman?s 20 year ETF AMEX:TLT. The direction of bonds has an impact on the stock market. Normally, as bonds go down, stocks will go up and as bonds go up, stocks will go down.
OIL Timing Indicator (AMEX:USO)

Want to trade OIL? Use our signals with AMEX:USO, the OIL ETF. We look at the price of oil as its level and direction has an impact on the stock market.
Secondary Stock Market Timing Indicator

We daily monitor hundreds of popular and proprietary technical indicators that break down market internals, sentiment and money flow to give us unique insight into the market. We feature at least one here each day in support of our current outlook.
As an annual subscriber to any of our premium services, you also get access to all our charts and research. Email Carl@stockbarometer.com to upgrade and also save 20% on your subscription.
Daily Stock Market Outlook
We remain in Buy Mode, looking for the markets to move higher into and through year end - all the way into January 12th. We are a little cautious here as we do have a move higher into a key reversal date and the markets are at resistance across several indices. Just be cautious, as seasonality can trump periodically.
This is a bond fueled rally. It's impact will play out as long as bonds retrace. How far? I generally look at the market as a series of numbers and previous price action. This chart suggests the market is not overbought by any means and can support a 1 to 3 week rally.

The other side of the equation is complacency - the below chart shows the level of call option buying is climbing strongly. But remember, this is a ratio - and doesn't tell you much about the volume. And relatively speaking, it can go much higher from here.

FYI, links from my 3 videos from the World Money Show are posted on my website . Just scroll to the bottom of the site. I'll leave them up there for the rest of this year. Just click here to get to my home page: stock market timing
If you want to learn more about some of these indicators, I use my blog to cover them in more detail.
If you're looking for more information, please visit our blog - I'll have updates and publish other articles there. http://investmentresearchgroup.com/Blog/
Regards,


