


12/30/2011 9:28:52 AM
Is setting up for 2012.
Many people ask me what I do. Are you a chart guy? I say sometimes? Are you a quant guy? I say sometimes. Are you a fundamental guy, and again, I say sometimes. As someone who has watched the market trade every day for over 12 years, and mathematically model it, every day. I like to think I have a good grasp on market movement.
So are markets efficient? Sometimes. Are they random? Sometimes. Can they be predictable? Again, sometimes.
My approach has always been that the best approach to the markets is to be either fixed or adaptive. In a fixed approach, you apply one strategy all the time. And when market conditions conform to that strategy - you will profit. The remainder of the time, you will not, so survival is key.
In an adaptive strategy, you try to identify the market conditions and apply the best strategy for those conditions. This can generate extreme cognitive biases due to factors such as competition.
The barometer is a fixed to moderately adaptive system, based on market conditions.
I also believe in a behavioral approach to the market. Issues such as loss aversion, overconfidence and overreaction create inefficiencies that we can exploit.
This is why I capture data from the market every day. Then peruse my over 200 indicators/models to identify potential opportunities and advise you daily. There are on average 7 good opportunities in the market over the course of a year. Some years may be better than others. And during certain periods, the market may consolidate, where no approach works. The key is not to get frustrated, but focus on positioning for the next move. The markets action tends to frustrate the masses just before it presents its greatest opportunities. Patience is rewarded.
As I traditionally do, I'll put out my 2012 forecast over the weekend.
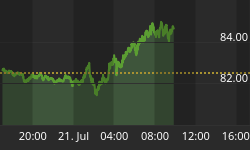
Here's a look at the global markets:

On the economic front, here is the schedule for this week. Pay close attention to the timing of the report and the potential for the markets to make short term reversals at those points.

On to the charts:

Stock Barometer Analysis
The barometer has ticked lower, but we remain in Buy "Support" Mode - meaning price action is bullish enough to keep us long here.
I still see a continuation of the move higher into early to mid January.
The Stock Barometer is my proprietary market timing system. The direction, slope and level of the Stock Barometer determine our outlook. For example, if the barometer line is moving down, we are in Sell Mode. A Buy or Sell Signal is triggered when the indicator clearly changes direction. Trend and support can override the barometer signals.
Money Management & Stops
To trade this system, there are a few things you need to know and address to control your risk:
• This system targets intermediate term moves, of which even in the best years, there are usually only up to 7 profitable intermediate term moves. The rest of the year will be consolidating moves where this system will experience small losses and gains that offset each other.
• This system will usually result in losing trades more than 50% of the time, even in our best years. The key is being positioned properly for longer term moves when they come.
• Therefore it is vitally important that you apply some form of money management to protect your capital.
• Trading a leveraged index fund will result in more risk, since you cannot set stops and you cannot get out intraday.
Accordingly;
• Make sure you set your stops so that you can lose no more than 2% per trade (based on the QQQQ if you're trading leveraged funds and options with our trading service).
Potential Cycle Reversal Dates
2011 Potential Reversal Dates: 1/15, 1/29, 2/16, 3/10, 3/18, 4/6, 5/21, 5/31, 6/13, 6/24, 7/16, 8/1, 8/19, 9/4, 9/25, 10/21, 10/25, 11/25, 12/26. We publish dates up to 2 months in advance.
The markets moved higher into our next key reversal date of 12/26. That would suggest that the next key reversal date, 1/12 - is critical. Generally, I would be bullish into 1/12 due to seasonal factors and the January Effect. I'm still leaning that way unless we get a sell signal. So stay tuned.
My Additional timing work is based on numerous cycles and has resulted in the above potential reversal dates. These are not to be confused with the barometer signals or cycle times. However, due to their past accuracy I post the dates here.
2010 Potential Reversal Dates: 1/19, 1/28, 3/2, 3/23, 4/7, 5/30, 6/10, 6/28, 7/10, 8/13, 9/7, 10/2, 10/27, 11/21, 12/19. We publish dates up to 2 months in advance. 2009 Published Reversal Dates: 1/20, 2/11, 3/7, 3/15, 4/8, 4/16, 4/27, 5/7, 6/8, 7/2, 7/17, 9/14, 10/10, 10/24, 11/12, 11/30, 12/9, 12/21, 12/29. 2008 Potential Reversal Dates: 12/31, 1/11, 2/1, 2/13, 3/6, 4/5, 4/22, 5/23, 6/6, 6/27, 7/13, 9/2, 10/3, 10/22, 11/10, 12/11. 2007 Potential Reversal Dates: 1/10, 1/14, 1/27, 1/31, 2/3, 2/17, 3/10, 3/24, 4/21, 5/6, 6/15, 8/29, 10/19, 11/29, 12/13, 12/23, 12/31, 1/11/08. 2006 potential reversal dates: 1/16, 1/30, 2/25, 3/19, 4/8, 5/8, 5/19, 6/6(20), 7/24, 8/20, 8/29, 9/15, 10/11, 11/28. 2005 Potential reversal dates: 12/27, 1/25, 2/16, 3/4, 3/14, 3/29, 4/5, 4/19, 5/2, 6/3, 6/10, 7/13, 7/28, 8/12, 8/30-31, 9/22, 10/4, 11/15, 11/20, 12/16.
Timing Indicators
Use the following Timing/momentum indicators to assist in your trading of the QQQQ, GLD, USD, USO and TLT. They are tuned to deliver signals in line with the Stock Barometer and we use them only in determining our overall outlook for the market and for pinpointing market reversals. The level, direction, and position to the zero line are keys in these indicators. For example, direction determines mode and a buy signal 'above zero' is more bullish than a buy signal 'below zero'.
QQQQ Timing Indicator (NASDAQ:QQQQ)

The QQQQ Spread Indicator will yield its own buy and sell signals that may be different from the Stock Barometer. It's meant to give us an idea of the next turn in the market.
Gold Timing Indicator (AMEX:GLD)

Want to trade Gold? Use our signals with the Gold ETF AMEX:GLD. Gold gives us a general gage to the overall health of the US Economy and the markets.
US Dollar Index Timing Indicator (INDEX:DXY)

Want to trade the US Dollar? Use our signals with the Power Shares AMEX:UUP: US Dollar Index Bullish Fund and AMEX:UDN: US Dollar Index Bearish Fund.
Bonds Timing Indicator (AMEX:TLT)

Want to trade Bonds? Use our signals with Lehman?s 20 year ETF AMEX:TLT. The direction of bonds has an impact on the stock market. Normally, as bonds go down, stocks will go up and as bonds go up, stocks will go down.
OIL Timing Indicator (AMEX:USO)

Want to trade OIL? Use our signals with AMEX:USO, the OIL ETF. We look at the price of oil as its level and direction has an impact on the stock market.
Secondary Stock Market Timing Indicator

We daily monitor hundreds of popular and proprietary technical indicators that break down market internals, sentiment and money flow to give us unique insight into the market. We feature at least one here each day in support of our current outlook.
As an annual subscriber to any of our premium services, you also get access to all our charts and research. Email Carl@stockbarometer.com to upgrade and also save 20% on your subscription.
Daily Stock Market Outlook
We remain in Buy Mode, looking for the markets to move higher into and through year end into January 12th.
The above chart shows the relationship between the SPY and QQQ. I see this relationship flipping as we hit the new year. The rate at which it flips and climbs will give us some indication on the extend o the move.
Some more things to chew on:

We are by no means near an extreme. Usually the market will stop going up when we reach an extreme flow in (unless we move into a liquidity advance).
I'm always looking for oddities in data - here's an interesting one you don't see all that often:

I'm not saying every extreme reading has meaning - just monitoring and pointing out some here. Generally, I would look at spx action to be institutional hedging.
On the volatility front, here's something that's bullish, on a contrarian basis.

All this considered, I'm bullish for the start of 2012! See you this weekend for my 2012 forecast - there's a big move coming!
If you want to learn more about some of these indicators, I use my blog to cover them in more detail.
If you're looking for more information, please visit our blog - I'll have updates and publish other articles there. http://investmentresearchgroup.com/Blog/
Regards,


