


1/10/2012 7:59:11 AM
The markets are breaking out 3 days ahead of our call for a top.
Tops are the most difficult thing to call in the market. I've written about this extensively in the past, so I won't bore you with a lot of details, but essentially bottoms are formed on fear, which is a very loud and easy to measure event. Tops are formed on hope, and over confidence, which are, as you would guess, the exact opposite of a bottom. It's one reason why markets are so good at fooling people into the markets at tops. And getting them to sell at bottoms. Evil Mr. Market :)

That being said, the extent of the market brak out will depend on a few things, namely the extent that bonds and the dollar pull back. So we'll be looking at all 3 for a signal of a top.
Now just so I'm clear, this may be 'a' top, and may not be 'the' top. Because there's a third stage of market moves that while they are the most rewarding, they are also the most difficult to call. The liquidity advance. I've been looking for a liquidity advance for a few months now - and we're at that position again. So we tend to give the markets a bit more room at these type of tops - just in case we move into a liquidity advance.
What to expect? If we get a liquidity advance, the barometer will move into sell mode, but prices will continue to rise.
If you're not a member of our free weekly mailing list, feel free to sign up by clicking here.
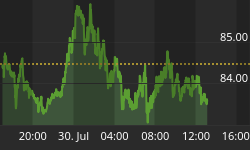
Here's a look at the global markets:

On the economic front, here is the schedule for this week. Pay close attention to the timing of the report and the potential for the markets to make short term reversals at those points.

On to the charts:

Stock Barometer Analysis
The barometer remains in Buy Mode. I still see a continuation of the move higher into early to mid January. 1/12 is our next key reversal date. Note the following week is options expiration. Sometimes markets can hang up into expiration.
The Stock Barometer is my proprietary market timing system. The direction, slope and level of the Stock Barometer determine our outlook. For example, if the barometer line is moving down, we are in Sell Mode. A Buy or Sell Signal is triggered when the indicator clearly changes direction. Trend and support can override the barometer signals.
Money Management & Stops
To trade this system, there are a few things you need to know and address to control your risk:
• This system targets intermediate term moves, of which even in the best years, there are usually only up to 7 profitable intermediate term moves. The rest of the year will be consolidating moves where this system will experience small losses and gains that offset each other.
• This system will usually result in losing trades more than 50% of the time, even in our best years. The key is being positioned properly for longer term moves when they come.
• Therefore it is vitally important that you apply some form of money management to protect your capital.
• Trading a leveraged index fund will result in more risk, since you cannot set stops and you cannot get out intraday.
Accordingly;
• Make sure you set your stops so that you can lose no more than 2% per trade (based on the QQQQ if you're trading leveraged funds and options with our trading service).
Potential Cycle Reversal Dates
2012 Potential Reversal Dates: 1/12, 1/27, 2/16. We publish dates up to 2 months in advance.
I am bullish into 1/12. What would be ideal is a market that peaks into 1/12, then turns lower into the 26th. I'd like to grab both those moves.
My Additional timing work is based on numerous cycles and has resulted in the above potential reversal dates. These are not to be confused with the barometer signals or cycle times. However, due to their past accuracy I post the dates here.
2011 Potential Reversal Dates: 1/15, 1/29, 2/16, 3/10, 3/18, 4/6, 5/21, 5/31, 6/13, 6/24, 7/16, 8/1, 8/19, 9/4, 9/25, 10/21, 10/25, 11/25, 12/26.2010 Potential Reversal Dates: 1/19, 1/28, 3/2, 3/23, 4/7, 5/30, 6/10, 6/28, 7/10, 8/13, 9/7, 10/2, 10/27, 11/21, 12/19. 2009 Published Reversal Dates: 1/20, 2/11, 3/7, 3/15, 4/8, 4/16, 4/27, 5/7, 6/8, 7/2, 7/17, 9/14, 10/10, 10/24, 11/12, 11/30, 12/9, 12/21, 12/29. 2008 Potential Reversal Dates: 12/31, 1/11, 2/1, 2/13, 3/6, 4/5, 4/22, 5/23, 6/6, 6/27, 7/13, 9/2, 10/3, 10/22, 11/10, 12/11. 2007 Potential Reversal Dates: 1/10, 1/14, 1/27, 1/31, 2/3, 2/17, 3/10, 3/24, 4/21, 5/6, 6/15, 8/29, 10/19, 11/29, 12/13, 12/23, 12/31, 1/11/08. 2006 potential reversal dates: 1/16, 1/30, 2/25, 3/19, 4/8, 5/8, 5/19, 6/6(20), 7/24, 8/20, 8/29, 9/15, 10/11, 11/28. 2005 Potential reversal dates: 12/27, 1/25, 2/16, 3/4, 3/14, 3/29, 4/5, 4/19, 5/2, 6/3, 6/10, 7/13, 7/28, 8/12, 8/30-31, 9/22, 10/4, 11/15, 11/20, 12/16.
Timing Indicators
Use the following Timing/momentum indicators to assist in your trading of the QQQQ, GLD, USD, USO and TLT. They are tuned to deliver signals in line with the Stock Barometer and we use them only in determining our overall outlook for the market and for pinpointing market reversals. The level, direction, and position to the zero line are keys in these indicators. For example, direction determines mode and a buy signal 'above zero' is more bullish than a buy signal 'below zero'.
QQQQ Timing Indicator (NASDAQ:QQQQ)

The QQQQ Spread Indicator will yield its own buy and sell signals that may be different from the Stock Barometer. It's meant to give us an idea of the next turn in the market.
Gold Timing Indicator (AMEX:GLD)

Want to trade Gold? Use our signals with the Gold ETF AMEX:GLD. Gold gives us a general gage to the overall health of the US Economy and the markets.
US Dollar Index Timing Indicator (INDEX:DXY)

Want to trade the US Dollar? Use our signals with the Power Shares AMEX:UUP: US Dollar Index Bullish Fund and AMEX:UDN: US Dollar Index Bearish Fund.
Bonds Timing Indicator (AMEX:TLT)

Want to trade Bonds? Use our signals with Lehman?s 20 year ETF AMEX:TLT. The direction of bonds has an impact on the stock market. Normally, as bonds go down, stocks will go up and as bonds go up, stocks will go down.
OIL Timing Indicator (AMEX:USO)

Want to trade OIL? Use our signals with AMEX:USO, the OIL ETF. We look at the price of oil as its level and direction has an impact on the stock market.
Secondary Stock Market Timing Indicator

We daily monitor hundreds of popular and proprietary technical indicators that break down market internals, sentiment and money flow to give us unique insight into the market. We feature at least one here each day in support of our current outlook.
As an annual subscriber to any of our premium services, you also get access to all our charts and research. Email Carl@stockbarometer.com to upgrade and also save 20% on your subscription.
Daily Stock Market Outlook
We remain in Buy Mode, looking for the markets to move higher into January 12th. The next dates after that take us into expiration.
The above chart shows gold volatility. One of the reasons we are bearish on gold is that when gold volatility peaks, it tends to need to consolidate. Couple that with our gold leading indicator, which was calling for a major move lower right on schedule, we're looking for gold to top with the market over the next week and set it's final bottom in Q1.
How about oil volatility?

The other side of the equation, oil volatility is closing in on a relative high. If the market is to top here and move lower into Feb/Mar, then so too will oil. But in the short term, it's off to the races with the market and a great time to be long.
If you want to learn more about some of my models, I use my blog to cover them in more detail.
If you're looking for more information, please visit our blog - I'll have updates and publish other articles there. http://investmentresearchgroup.com/Blog/
Regards,


