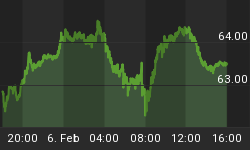
2 consecutive attempts of initiating a pull back have been aborted by dip buyers. But this up leg is getting stretched and it is due for a pause.
On Monday US markets will be closed for the Martin Luther King holiday then next Friday we have monthly Opex, which has a negative track record for the bulls, hence I believe that next week the risk of a pullback will be large.
We have daily Stochastic way overbought and the RSI within a steep rising trend line that can be easily breached. Regarding the RSI as long as the 50 line is not breached the due pullback will not damage the EW pattern form the October 4 low.
On the breadth side I am monitoring the McClellan oscillator, which is approaching the 60 line, btw at yesterday eod it closed with a small negative divergence.

Short term EW Pattern:
My scenario remains the same, which calls for a Zig Zag off the October 4 low.
Therefore price is now tracing the wave (C).
The issue that remains to be solved is if price is unfolding an impulsive 5 -wave up leg or an Ending Diagonal.
Two events can increase the odds of an impulsive wave (C):
- The strength of the US financial sector. Here I am monitoring BAC, which has a potential wave (B) in progress.
- A potential wave (B) counter trend rebound of the EUR.
There is a potential Double Bottom reversal pattern which projects price towards the 1.3000 area. If it s achieved then price will breach a bearish trend line and open the door for more upside with a potential target at the 50 dsma = 1.3214
These 2 potential scenarios, it they pan out, should support a move of SPX into this summer highs.
If SPX is tracing an impulsive wave (C) then I even assume that price may be involved in an extended wave (3). If this is the case, in the next pull back, the wave (II) will have to be shorter then 64.69 points and last less then 8 days, therefore the target should be located in the range 1257.60 (gap fill + 200 dsma) - 1243 (50 dsma)
If the EUR fails to break to the upside then the Ending Diagonal option will regain traction.
For the s/t the structure remains bullish with a potential Double Bottom, which would allow additional strength into the 1308 area.
I am anxiously waiting for next pullback, since price will make a statement regarding the EW structure of the wave (C).
In the mean time have a great weekend.


