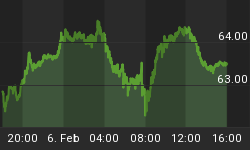
We have all heard of the proverbial "glass ceiling" in the business world where one attains a certain level of achievement and is unable to advance any further.

Well, the same thing happens to share values from time-to-time. They reach a certain price level, and no matter how hard they try, they are simply unable to shatter the glass ceiling overhead.
Price charts clearly reflect such episodes and offer some analog-based clues as to what may manifest following these prolonged battles at overhead resistance.
We provide two such examples below. One is an analog from the distant past, and the other is playing out in real time. Both are major equity indices. Can you recognize either of these popular equity indices?

Does either of these look familiar? What indices are they? Which is the old, and which is the new?

The first index on top sports 6-tests at the glass ceiling of resistance, while the second index shows five attempts at breaking through the resistance barrier.
If you think you have identified either of these beauties, which is the chart of the distant past and what was its outcome? Which is the chart currently unfolding in real time? What are the general time-periods of both the old and the new?
Well, that's all for now. Don't worry, we won't' leave you hanging for long. In the next few days, we will provide a follow up piece with all of the answers along with some forward-looking analysis as well.
Do reply with a post or send us an email with your best guesses.
What do you say we make things a bit more interesting?
How about:
- The first thirteen non-subscribers (all of our current subscribers already know the answers) who get the two markets correct will get a complimentary issue of our Near Term Outlook.
- The first eight (non-subscribers) who get the two markets and analog outcome correct will get a complimentary issue of EWT's Charting Bundle.
- Finally, the first five (non-subscribers) to also provide the general time-periods for each of the charts, will get a complimentary issue of the Chart-Cast Pilot.
We will give you one last hint. One of the indices is a chart of daily closing prices, while we have rendered the other using a chart of monthly closes.
Now post/mail in your answers and we will report all winners with the follow-up feature and analysis by the weekend.
Until then,
Trade Better/Invest Smarter


