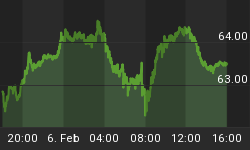
Despite obvious signs of economic recovery, including the brisk demand for 'big ticket' machine tools as noted on the blog yesterday, seasonally and non-seasonally adjusted jobless claims improving, a constructive Silver-Gold Ratio (SGR, chart below), implying improving general market liquidity with SGR's proximity to major support that NFTRH has been following for the last couple of months; despite these positive signs Ben Bernanke and the US Fed hold resolutely to a cautious view of the US economy. As part of this resolution, they have committed to hold rates near zero until late 2014. Huh? What gives? Will this not create inflation?
One might be confused by this easy policy if one believes that organic economic cycles are anything more than a distant memory. As credit and leverage related abuses began to be hard wired into the system at the end of the 20 year secular bull market in 2000, the age of 'Inflation on Demand' began. Inflationary monetary gimmicks of epic proportions are now employed the world over in order to micro manage economies through ever more desperate policy. Evidently, bear markets have been made illegal in favor of a secular inflationary 'asset grab'; now over a decade old and subject to periodic 'deflationary' meltdowns.
What NFTRH and indeed this blog have been calling i2k12 (inflationary 2012) is not to be celebrated. It is something to be speculated upon and thankful for if you are on the right side of it. But when it begins to ramp down (my guess is sometime post-US election) and ultimately resolve in another meltdown, it will be time to once again to give Prechter (along with the entire cadre of lesser 'dBoys') his due once again.
Presenting again the absolute, number one most important chart in the financial world. The monthly view (AKA the 'Continuum' here in Biiwii land) of the 30 year Treasury yield is a general road map. Within this chart's generalities, we must dial in shorter term analysis for ongoing market management. But in the big picture we are able to lock on to a view that allows us to keep perspective and balance as the cycles play out. These cycles ping between inflationary and deflationary and grind up the best of 'em, like Bill Gross and his T bond short play early last year (most recent red arrow).
It is a sad irony in the financial markets that the deflationists and bears tend to look like heroes at the exact moment they should be shunned (green arrows) and goats when they should be heeded (red arrows), for an intermediate down cycle at least.
Human beings by their nature are social beings and they tend to look to each other for guidance, comfort and inspiration. This is such a nice quality in life, but it will kill you in the financial markets. Man needs tools... so he will not out think himself!
The bottom line that we are leading up to is this; if the yellow shaded area on the chart above holds - and shorter time frame charts of TYX hint that it will - then there is a lot of room left in i2k12 for bears to get out of the line of fire. The interim cycles tend to ping the boundaries and if 2012 unfolds the way I expect, the time to once again shift out of asset markets will not be until a red arrow appears once again at the monthly EMA 100. Meanwhile, I have been expecting an interim (and routine) correction, which thus far has not visited. Bears might take note and at least consider using the next correction to get right with the market gods.
Another point to consider is that with the debt and leverage hard wired in to the system (Bernanke is no idiot), a bubble in precious metals is not only technically possible, but could be desirable for global policy makers looking to re-liquefy the monetary system. Or maybe they want a more generalized asset grab, making the rich (asset owners) richer and the poor well, more marginalized and more dependent. This would of course have profound implications on near future tax policy.
There is so much more to write about here in Wonderland (the alternate world constructed where relatively normal financial markets once stood), but once again a post that was meant to be succinct got a little out of hand. Luckily, there will be plenty of time to paint in the details going forward. If you would like to join me in what has been a very successful journey so far, consider a subscription to NFTRH.


