
Here's a new video (with a special appearance by Tom Demark) explaining some of the methodology and significance behind my Meridian charts.


"No warning can save people determined to grow suddenly rich" - Lord Overstone
 |
Gold •748 days | 2,368.70 | +35.30 | +1.51% |
|
Platinum •20 mins | 1,632.50 | +28.50 | +1.78% |
|
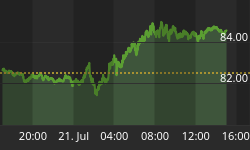
WTI Crude •11 mins | 84.29 | +1.81 | +2.19% |
|
Gasoline •11 mins | 3.417 | +0.028 | +0.81% |
|
Ethanol •748 days | 2.161 | +0.000 | +0.00% |
|
Silver •748 days | 30.82 | +1.16 | +3.92% |
 |
Silver • 748 days | 30.82 | +1.16 | +3.92% | |
|
Copper • 748 days | 4.530 | +0.111 | +2.51% | |
|
Brent Crude • 11 mins | 91.04 | +1.82 | +2.04% | |
|
Natural Gas • 11 mins | 2.852 | -0.008 | -0.28% | |
|
Heating Oil • 11 mins | 4.101 | -0.018 | -0.43% |

During the quarter there were…

An economic slowdown in many…

This aging bull market may…
Here's a new video (with a special appearance by Tom Demark) explaining some of the methodology and significance behind my Meridian charts.
Sign up to the


