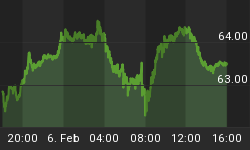
Yesterday, we noted some bad news would probably be needed to tip the scales in this market. This morning's economic data fits the "bad news" bill. From Reuters:
New orders for long-lasting manufactured goods fell in January by the most in three years as demand slumped across the board, suggesting the economy started the year on weaker footing than expected. Durable goods orders dropped 4.0 percent, the biggest decline since January 2009 when the country was still mired in a deep recession, according to Commerce Department data on Tuesday.
We often use the Summation Index as a way to monitor the markets "internals". The Summation Index is a market breadth indicator that is derived from the number of advancing and declining stocks in a given market. The concept of breadth is easy to understand; healthy markets have broad participation during rallies (a stable or rising Summation Index).
The charts below are busy, but the concepts are simple. In the present day (shown below), the Summation Index climbed above 1,300 and has now started to decline (see orange box and blue arrow top right). The blue arrows to the left show the previous times the Summation Index turned down after a rally in stocks; the S&P 500 corrected soon thereafter (see purple boxes at bottom). Corrections in stocks (purple boxes) also occurred after RSI turned down from high levels (red boxes top); the far right red box shows the similar setup we have in RSI today, which leans bearish.

The concepts presented in the chart above apply to the 2003-2004 chart below as well. The Summation Index turned down from above/near 1,300 and stock market weakness/consolidation followed. RSI (red boxes below) also dropped below 70, just as it has today (red box above far right).

The chart below takes a closer look at the 2003 case. After the Summation Index rolled over from a level near 1,300, the S&P 500 dropped 5% over the next two weeks.

The setup in 2009 was similar. Stocks dropped 5.5% in three weeks (point A), rallied 8.7% over the next three weeks (B), and then dropped 9.1% over the next four weeks (C).

The takeaways for us today are (a) the odds favor some type of pullback beginning in the next week or so, (b) markets may be volatile for a time while making little progress, and (c) we have to be open to higher highs in the coming months. As noted in yesterday's post/video, two items carry a bullish bias in the short-run: (1) the take up of ECB's second round of three-year loans is announced Wednesday, and (2) Wall Street likes to "mark up" stocks at month end.


