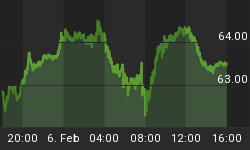
The market is back to casting about for the next source of fear. Today, it was China. Fears that the Chinese economy may be slowing pushed both stocks (-0.3%) and commodities (-1.5%) down. The Chinese economy, although only 1/3 as large as the US economy, is a disproportionate share of global growth and so the fear is that a meaningful slowdown in China could cause the demand for raw goods to drop significantly.
There are big problems in China, starting with the banks. A discussion of the weaknesses of China's economic situation is beyond our purpose here (as well as being beyond my expertise), but what should be kept in mind is that an implosion of the Chinese economy is quite unlikely. China does not have a capitalist system, and preventing a run on banks is much easier in a nation that doesn't face the rigor of free markets. And if you thought printing money proved too easy in the "open" economies, how much easier is it in the "closed" economy? I think the forecasts of Chinese economic hegemony in the foreseeable future are more misplaced than the forecasts of Japanese hegemony were in the mid-1980s, and we can see how that worked out. But I also suspect that we will not see a "crisis" in China very soon. Again, it's not my core expertise so I may well be wrong.
But I think that in any case, people who are thinking the slowdown in the Chinese economy will cause a sharp fall in commodities prices are unlikely to be right, for several reasons. First, absent an actual recession in China it seems to me that the worst case is that demand will rise less than it otherwise would have, but a global commodity supply glut seems unlikely as long as the country continues to grow.
The second, and more important, is that the notion that slowing growth ought to hurt commodities significantly represents partially a confusion of real and nominal quantities. The chart below shows the common thought process, and seeming empirical support for it. The chart shows Real GDP versus the SP-GSCI Non-Energy Spot commodity index (that is, the level of commodities, ex-energy commodities, ignoring collateral return and other sources of excess return to a commodity index). The fit is striking: when real GDP goes up, so does the commodity index; when real GDP goes down, so does the commodity index.

The only little problem is that this is clearly comparing apples to organges. Real GDP is measured with constant prices from a base year; commodities are priced in current dollars. The chart below is the right comparison - Nominal GDP versus spot commodity indices - and the fit, while still fine, is definitely worse.

Oh, and by the way these charts only look kinda good because of the massive ripple in 2008-09. If we take a longer view, the relationship breaks down. It doesn't matter if you look at 1990-2012 (shown below) or 1970-1990, the fit in either case is useless. Not even close. The best you can say is that they both went up in the long run.

What is missing in these charts is a sense of the tightness or looseness of monetary policy, but in this third chart you can sketch some broad themes. When domestic GDP growth is relatively quick, compared to money supply growth (that is, policy is tight or neutral), then the commodity index moves lower. The early 1990s saw weak money growth; the late 1990s saw better M2 growth but the economy was growing at a much more rapid clip as well. In the 2000s, weaker growth as a function of several recessions corresponded with rapid money growth, and commodities rose significantly. It's difficult to construct a fair-value metric that balances these factors and takes into account the fact that commodities are often priced in dollars but obviously not all consumed in the US. But the 2001-2008 and 2009-2011 experience is telling: if slow growth in the world's largest economy didn't restrain commodity growth, then slow growth in an economy one-third the size probably won't either.
And yes, I understand that China also consumes much more in the way of commodities than its GDP would suggest it should, relative to the US. A collapse of the Chinese economy might give me pause. But rapid growth of the global money supply appears to me to be a much stronger effect, judging from Chart 3.
Incidentally, I think one way you can tell that the average age of portfolio managers and traders is under 50 is that it is very easy for these investors to sell commodities at the first sign of weakness - because, after all, that has been a good trade for most of the last 30 years, until 2005 or so. There are not very many practicing institutional investors who clearly remember the last good bull market in commodities! The same statement applies to bonds, to a lesser extent, but at least bonds have a connection to fair value that we think we understand better, and they teach fixed-income mathematics in schools. No one talks about Lean Hogs.
I continue to think that commodities are undervalued relative to the significant increase in the money supply, and I continue to hold a significant weight in commodity index ETFs.


