


3/26/2012 8:35:34 AM
Futures are up this AM as we approach the end of the quarter.
Now I'll be the first to tell you never to trust a Monday morning gap up. But the market has been resilient - and closing price action has been strong - keeping us LONG this market.
Either way, we remain LONG, but we're going to maintain our recommendation to go into Sell Mode on a bearish close of the QQQ below the 66.79 level.
If we get another leg higher, great. If we don't, then we'll get positioned for downside. This move reminds me a lot of 2006. Here's what I mean:

That move ended with a slight break of previous highs followed by a reversal. I'm not expecting a huge pullback - and we may just get a consolidation - even though our forecast chart seems to be predicting a larger move lower. We'll monitor that as the days and weeks come.
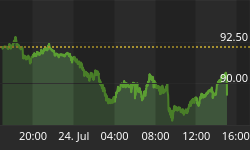
Here's a look at the global markets:

On the economic front, here is the schedule for this week. Pay close attention to the timing of the report and the potential for the markets to make short term reversals at those points.

On to the charts:

Stock Barometer Analysis
While we remain LONG, the barometer has moved into Sell Mode, and we will go short on a QQQ close below the 9dma.
The Stock Barometer is my proprietary market timing system. The direction, slope and level of the Stock Barometer determine our outlook. For example, if the barometer line is moving down, we are in Sell Mode. A Buy or Sell Signal is triggered when the indicator clearly changes direction. Trend and support can override the barometer signals.
Money Management & Stops
To trade this system, there are a few things you need to know and address to control your risk:
• This system targets intermediate term moves, of which even in the best years, there are usually only up to 7 profitable intermediate term moves. The rest of the year will be consolidating moves where this system will experience small losses and gains that offset each other.
• This system will usually result in losing trades more than 50% of the time, even in our best years. The key is being positioned properly for longer term moves when they come.
• Therefore it is vitally important that you apply some form of money management to protect your capital.
• Trading a leveraged index fund will result in more risk, since you cannot set stops and you cannot get out intraday.
Accordingly;
• Make sure you set your stops so that you can lose no more than 2% per trade (based on the QQQQ if you're trading leveraged funds and options with our trading service).
Potential Cycle Reversal Dates
2012 Potential Reversal Dates: 1/12, 1/27, 2/16, 2/23, 3/16, 4/9, 4/25. These dates have an accuracy of +/- 2 days. We publish dates up to 2 months in advance.
Our next two KRDs are 4/9 and 4/25, I see markets moving lower into 4/9 at a minimum.
Subscribers to our IRG Market Timing and Sentiment data service can see the performance of these forecast turn dates going back to 2003 and for the remainder of 2012.
My Additional timing work is based on numerous cycles and has resulted in the above potential reversal dates. These are not to be confused with the barometer signals or cycle times. However, due to their past accuracy I post the dates here.
2011 Potential Reversal Dates: 1/15, 1/29, 2/16, 3/10, 3/18, 4/6, 5/21, 5/31, 6/13, 6/24, 7/16, 8/1, 8/19, 9/4, 9/25, 10/21, 10/25, 11/25, 12/26.2010 Potential Reversal Dates: 1/19, 1/28, 3/2, 3/23, 4/7, 5/30, 6/10, 6/28, 7/10, 8/13, 9/7, 10/2, 10/27, 11/21, 12/19. 2009 Published Reversal Dates: 1/20, 2/11, 3/7, 3/15, 4/8, 4/16, 4/27, 5/7, 6/8, 7/2, 7/17, 9/14, 10/10, 10/24, 11/12, 11/30, 12/9, 12/21, 12/29. 2008 Potential Reversal Dates: 12/31, 1/11, 2/1, 2/13, 3/6, 4/5, 4/22, 5/23, 6/6, 6/27, 7/13, 9/2, 10/3, 10/22, 11/10, 12/11. 2007 Potential Reversal Dates: 1/10, 1/14, 1/27, 1/31, 2/3, 2/17, 3/10, 3/24, 4/21, 5/6, 6/15, 8/29, 10/19, 11/29, 12/13, 12/23, 12/31, 1/11/08. 2006 potential reversal dates: 1/16, 1/30, 2/25, 3/19, 4/8, 5/8, 5/19, 6/6(20), 7/24, 8/20, 8/29, 9/15, 10/11, 11/28. 2005 Potential reversal dates: 12/27, 1/25, 2/16, 3/4, 3/14, 3/29, 4/5, 4/19, 5/2, 6/3, 6/10, 7/13, 7/28, 8/12, 8/30-31, 9/22, 10/4, 11/15, 11/20, 12/16.
Timing Indicators
Use the following Timing/momentum indicators to assist in your trading of the QQQQ, GLD, USD, USO and TLT. They are tuned to deliver signals in line with the Stock Barometer and we use them only in determining our overall outlook for the market and for pinpointing market reversals. The level, direction, and position to the zero line are keys in these indicators. For example, direction determines mode and a buy signal 'above zero' is more bullish than a buy signal 'below zero'.
QQQ Timing Indicator (NASDAQ:QQQ)
The QQQQ Spread Indicator will yield its own buy and sell signals that may be different from the Stock Barometer. It's meant to give us an idea of the next turn in the market.
Gold Timing Indicator (ARCX:GLD)
Want to trade Gold? Use our signals with the Gold ETF AMEX:GLD. Gold gives us a general gage to the overall health of the US Economy and the markets.
US Dollar Index Timing Indicator (INDEX:DXY)
Want to trade the US Dollar? Use our signals with the Power Shares AMEX:UUP: US Dollar Index Bullish Fund and AMEX:UDN: US Dollar Index Bearish Fund.
Bonds Timing Indicator (AMEX:TLT)
Want to trade Bonds? Use our signals with Lehman?s 20 year ETF AMEX:TLT. The direction of bonds has an impact on the stock market. Normally, as bonds go down, stocks will go up and as bonds go up, stocks will go down.
OIL Timing Indicator (AMEX:USO)
Want to trade OIL? Use our signals with AMEX:USO, the OIL ETF. We look at the price of oil as its level and direction has an impact on the stock market.
Secondary Stock Market Timing Indicator

We maintain hundreds of popular and proprietary technical indicators that break down market internals, sentiment and money flow to give YOU unique insight into whether you should BUY or SELL the market. We feature at least one here each day in support of our current outlook.
As a subscriber to the Daily Stock Barometer System at the $50 level, you also get access to all our charts and research. Email Carl@stockbarometer.com to upgrade your subscription.
Daily Stock Market Outlook
We remain in Buy Mode, but the barometer has moved into sell mode and all we're looking for is price action to confirm. If the markets remain in this liquidity advance, that should not happen. However, if liquidity starts pulling back, we'll see more bearish price action follow.
Our above cycles/seasonality chart shows that Friday was a 10 week cycle high. Again, in a liquidity advance, these cycles will be negated. You never know when the liquidity plug will get pulled. The key is to maintain your strategy as it eventually will.
Market advances have certain characteristics. With the new highs, you'll see them oscillate higher and lower. If the market is going to make another advance, this will move back towards the peak. A lower high could be a bearish sign.

And finally, we have an update to the ECRI WLI GROWTH - which I put up on my blog here. ECRI WLI.
Here's our current positioning.
- Last Recommendation - 3/12,13 - Long qqq (Note recommendation above)
- Status - Long QQQ
- Consideration - Maintain stop per money management above. I would consider raising the stop along with the 9dma - or even raising it to your entry point - just in case.
Retirement Advisory (this is a weekly system)
- Current positioning - 3/3 Long Exposure. Move back to a 3/3 positioning until we see more of a peak in this rally.
- Move to 1/3 on a SPY WEEKLY close below 137.09 (currently at 140.21)
- Move to cash on a SPY WEEKLY close below 136.01.
- Stock/Bond rebalance - As bonds move lower, we should approach levels where I will suggest moving money from stocks to bonds. We're not there yet, but stay tuned. If you have access to the NYSE data base, it's the chart labeled s-b-x.
- We remain on a longer term put cash to work signal from September, 2010. However, we're beginning to see the potential for weakness. We do not have a potential crash signal at this time, although we are moving towards one.
Subscribers to our Market Timing and Sentiment data service can access our bond stock rebalance model, long term cash buy signals and crash alerts on the NYSE and NASDAQ updated weekly.
As we consolidate the Retirement Plus 1-2-3 Service into the Daily Stock Barometer, look here for advice on long term signals to put cash to work, bond/stock reallocation signals and cautionary crash warnings on the stock market.
Gas/Oil Hedge Advisory - Seasonally, oil bottoms in early February, peaks in July and moves lower for the remainder of the year, stabilizing around the heating season in September/October. You can see our seasonality indicators in the data base.
If you want to learn more about some of my models and indicators, I use my blog to cover them in more detail. If you're looking for more information, please visit our blog - I'll have updates and publish other articles there. http://investmentresearchgroup.com/Blog/
Regards,


