• 802 days Will The ECB Continue To Hike Rates?
  • 802 days Forbes: Aramco Remains Largest Company In The Middle East
  • 804 days Caltech Scientists Succesfully Beam Back Solar Power From Space
  • 1,204 days Could Crypto Overtake Traditional Investment?
  • 1,209 days Americans Still Quitting Jobs At Record Pace
  • 1,211 days FinTech Startups Tapping VC Money for ‘Immigrant Banking’
  • 1,214 days Is The Dollar Too Strong?
  • 1,214 days Big Tech Disappoints Investors on Earnings Calls
  • 1,215 days Fear And Celebration On Twitter as Musk Takes The Reins
  • 1,217 days China Is Quietly Trying To Distance Itself From Russia
  • 1,217 days Tech and Internet Giants’ Earnings In Focus After Netflix’s Stinker
  • 1,221 days Crypto Investors Won Big In 2021
  • 1,221 days The ‘Metaverse’ Economy Could be Worth $13 Trillion By 2030
  • 1,222 days Food Prices Are Skyrocketing As Putin’s War Persists
  • 1,224 days Pentagon Resignations Illustrate Our ‘Commercial’ Defense Dilemma
  • 1,225 days US Banks Shrug off Nearly $15 Billion In Russian Write-Offs
  • 1,228 days Cannabis Stocks in Holding Pattern Despite Positive Momentum
  • 1,229 days Is Musk A Bastion Of Free Speech Or Will His Absolutist Stance Backfire?
  • 1,229 days Two ETFs That Could Hedge Against Extreme Market Volatility
  • 1,231 days Are NFTs About To Take Over Gaming?
What's Behind The Global EV Sales Slowdown?

What's Behind The Global EV Sales Slowdown?

An economic slowdown in many…

How The Ultra-Wealthy Are Using Art To Dodge Taxes

How The Ultra-Wealthy Are Using Art To Dodge Taxes

More freeports open around the…

Zombie Foreclosures On The Rise In The U.S.

Zombie Foreclosures On The Rise In The U.S.

During the quarter there were…

  1. Home
  2. Markets
  3. Other

Current Gold and Oil Trading Patterns Unfolding

The past two months we have seen all the focus from traders and investors be on the equities market. And rightly so and stocks run higher and higher. But there are two commodities that look ready to explode being gold and oil (actually three if you count silver).

Below are the charts of gold futures and crude oil 4 hour charts. Each candle stick is 4 hours allows us to look back 1-2 months while still being able to see all the intraday price action (pivot highs, pivot lows, strong volume spikes and if they were buyers or sellers...).

The 4 hour chart is one time frame most traders overlook but from my experience I find it to be the best one for spotting day trades, momentum trades and swing trades which pack a powerful yes quick punch.

As you can see below with the annotated charts both gold and silver are setting up for higher prices in the next 1-2 weeks from a technical point of view. That being said we may see a couple days of weakness first before they start moving up again.

Click here to watch a detailed screencast video analysis: www.thetechnicaltraders.com/ETF-trading-videos/

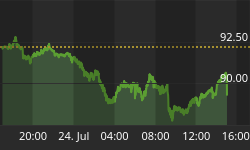
4 Hour Momentum Charts of Gold & Oil:
4 Hour Momentum Charts of Gold & Oil


Back to homepage

Leave a comment

Leave a comment