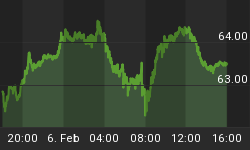
The trends of the three main US indices (DJIA, NDX and SPX) remain up in all three time frames - daily, weekly and monthly.
The end of the month is a good time to look at the longer-term picture. The two charts below show the results from a monthly scan of the OEX 100 component stocks, including the major industry spiders, based on two indicators which form the core of the Oddstrader app family; namely, the risk/reward (overbought/oversold) indicator:

and trend indicator:

The respective NDX scans can be found on my blog.
The expected SPX rebound arrived right on cue and the index remains firmly above the pivot line, which has moved up to 1390:


