


As discussed:
I have a bullish bias for the long-term EWP:
- Price is tracing the wave (X) off the November 2008 low.
- The wave (X) is tracing a Double Zig Zag.
- Price should have established the top of the wave (A) of the second ZIg Zag.
- The wave (B) should bottom in the range of the 6 m MA = 1328 - 1258, keeping in mind that at 1273 we have the 200 d MA.
- Alt Count: Price from the October 4 low is unfolding a Double Zig Zag, hence within the wave (A) price has established the top of a wave (W), in which case the current pullback is a wave (X).
- Once the wave (B) or (X) is in place price will resume the intermediate uptrend with a potential target in the area of the 2007 top. Both options imply a multi-week correction that could last into the month of June.
In the monthly time frame we can highlight a wide target range = 1328 - 1258

I have a bearish bias for the short-term EWP:
In the weekly chart below we can see the potential completed Zig Zag off the October 4 low. The loss of the 10 w MA is a strong indication of the trend reversal.

In addition, on Friday, the weekly RSI has breached the Trend Line Support in force since August.

In the weekly time frame we can obtain a detailed view of the support areas that can be challenged by the corrective pattern in progress: 1340 - 1328 - 1300/1292 - 1279
It seems that the majority is looking at the 1340 area, then maybe the 20 w MA = 1328 will come into play as an intermediate target while the range 1300 - 1279 could be tested as a final target if price unfolds a large correction.
Regarding the potential EWP, price should unfold one of the following:
- Zig Zag /Double ZZ
- Flat
- Triangle
Therefore price should be now involved in tracing the first down leg, which I am labeling as wave (A=ABC) that should be aiming at the first target support in the area of 1340-1328.
Even if a move to 1340-1328 could complete a corrective EWP I believe that the odds of a larger retracement are quite substantial, therefore I expect a large rebound followed by at last one more leg down.
3 issues must be taken into account in order to try to be on the right side of the EWP:
- The Summation Index is extremely oversold. It can remain oversold for a longer period of time, but at some point, the weekly stochastic will issue a multi-week buy signal.

- Bullish Investor sentiment has collapsed. Extreme Bull Ratio readings usually occurs when the equity market establishes a top or a bottom.

- Fear should creep up frightening investors. Judging from the 10 dsma of CPCE it remains too low, as previous market bottoms have occurred at much higher readings.

Short-term price action:
I am expecting another down leg, a wave (C), off the April 2 peak that should at least match the 64.80 points drop of the first down leg.

Given the choppy price action of the last two days, keep in mind that a wave (C) has to be impulsive, even though there seems to be selling pressure at the 50 d = 1376.50, it seems that price has not established yet the top of the wave (B). In addition yesterday's Doji fits better as a bottoming candlestick rather then a bearish one.
If price has more business to accomplish before beginning the second leg down we can expect a sideways move shaping a triangle or a zig zag higher that should be capped in the range 1396-1398.
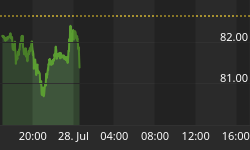
AAPL has confirmed the ending pattern I suggested on April 8. The down side actions looks impulsive, but a fiver is almost completed, hence a wave (2 / B) bounce should be around the corner.

Monthly Opex next Friday and above all FOMC meeting + Bernanke press briefing next Wednesday could delay the kick off the assumed wave (C) down.


