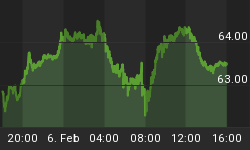
A mixed start with price even unfolding a potential reversal pattern was suddenly reversed with a solid follow-through pushing price above the 1392.76 pivot resistance and achieving a bullish Island Reversal by closing the gap at 1398.08
In addition we now have a potential Double Bottom that could carry price above the April 2 peak.
The picture looks bullish but I cannot desist from considering the EWP from the April 2 peak not completed, since the internal structure of both upward and downward moves has been corrective, then the absence of an impulsive decline makes very doubtful that price has completed a corrective EWP from the April 2 top.
EW wise the Zig Zag = ABC should not be considered over, hence the probability that price has resumed the intermediate up trend is small. Therefore as I mentioned yesterday:
"I maintain the idea that price from the April 2 top will unfold a Zig Zag down. Therefore on April 10 price has established the bottom of the wave (A), now price in involved in tracing a corrective wave (B). Once the wave (B) is in place, price will unfold an impulsive wave (C) down that could match the 65 points drop of the wave (A)."
The unanswered question remains from where the wave (C) will begin, since now the assumed current wave (B) theoretically can retest the April 2 peak.
The critical issue now lies in the extent of a likely pull back that could occur today and the ability of price to hold above the 50 d MA = 1382. Since if the 50 d MA holds then a second up leg off the April 23 low will most likely carry price to retest the April 2 peak.
If the SPX's EWP could eventually allow the resumption of the uptrend with "creative counting" and/or a truncated wave (C), the Dow price structure in my opinion clearly suggests that price is involved in a corrective pattern and not in the beginning of a bullish move.
So allow me to remain skeptical but as I mentioned yesterday the key issue here is how momentum and breadth indicators behave since despite the EWP suggests that price should still be involved in a larger corrective pattern I cannot deny the bullish effects that would result from "buy signals".
Actually the McClellan Oscillator is now the main concern for the validity of my preferred scenario.

The thrust above the zero line if it does not reverse quickly it will most likely trigger a buy signal of the Summation Index increasing the probability of rising equity prices.

In the mean time the VIX inverted H&S pattern is most likely dead while the EUR EWP remains shaky and I maintain my bearish scenario, if price does not break above the Trend Line resistance, of a pending Zig Zag down.
Have a great weekend everyone.


