


A 3-dimensional approach to technical analysis
Cycles - Structure - Price projections
"By the Law of Periodical Repetition, everything which has happened once must happen again, and again, and again -- and not capriciously, but at regular periods, and each thing in its own period, not another's, and each obeying its own law ... The same Nature which delights in periodical repetition in the sky is the Nature which orders the affairs of the earth. Let us not underrate the value of that hint." -- Mark Twain
A Review of the Past two Weeks
This was the comment made 2 weeks ago:
It is apparent that, after the initial sell off, there is a great deal of deceleration taking place, and this is always the precursor to a reversal. Deceleration occurs when there are several cycles affecting the stock market simultaneously and they start to make their lows one at a time. This process is likely to continue until near the end of the month before we have a technical condition which permits a new up trend to develop.
A low point was reached for all the averages on Monday 1/25, and in spite of an attempt at resuming the decline last Friday, prices held above former lows and rallied at the close. This is a sign that the recent lows may hold, but we still have to get through the next couple of trading days to be sure.
The breadth indicators are confirming this possibility. The McCellan oscillator (A/D) is showing some good positive divergence which has gotten more definite in the past few sessions. It has a down trend line running just below the "0" line currently, which will have to be penetrated at the same time as down trend lines are penetrated on the indexes to signal a legitimate reversal to the upside.
The NH/NL indicator has also held very well in this decline and is now attempting to resume its up trend.
Oil may be the defining factor. On Friday, it was down sharply and this undoubtedly had some effect on the market and prevented it from selling off more drastically. I believe that it may have ended its upward correction and may be ready to retrace, although there could be some more distribution in this area. Whether it will be able to break below 40 on its next down wave remains to be seen.
Gold, as suggested in the last newsletter, is taking a breather, but it's probably only a matter of time before it resumes its down trend.
Current Position of the Market.
SPX: Long Term Trend - The long term trend turned up in October 2002 in conjunction with the 12-year cycle. It is now reinforced by the 10-year cycle which turned up in the Fall of 2004. A top is likely in 2005.
SPX: Intermediate Trend - The intermediate up trend is still in progress, but a short-term correction is taking place which may last into mid-February before trying to push higher (see What's next).
SPX: The Short-term trend is far along in its correction and should be much closer to the bottom than the top.
Because of market volatility, the short term trend is better analyzed on a daily basis with the help of hourly charts. This is done in our daily market updates and Closing Comments.
Daily market analysis: If you would like to receive an explanation of how I arrive at buy and sell signals and be notified on the day that they occur, please let me know at ajg@cybertrails.com.
What's next?
Last week, indexes made a potential low for the short-term trend, and it is in the process of being tested. However, although I pay only partial attention to seasonal statistics, January is regarded as the strongest month of the year, and February as the weakest. Will their normal behavior reverse this year? Or does the weak -- instead of strong -- January portend an even weaker February? I believe that seasonality is, like everything else, geared to cyclic configurations, which are always shifting. Therefore, I pay more attention to cycles than to seasonal trends. Two weeks ago I wrote:
The next important cycle to be concerned about is the 20-week cycle which makes its low in 5 weeks, but, like all cycles, it is subservient to the influence of larger cycles, so it may only bring about a minor correction in prices. In any case, as always, there will be plenty of warning from A/D, NH/NL, and momentum indicators. First we'll concentrate on identifying the low of the current correction and then we can turn our attention to the next top.
The above remains our analytic priority. In pulling back to 1163, the SPX came down into its (Fib.) projected range of 1161/1170 and found support. But we must keep in mind that a normal 50% retracement could take the market all the way down to 1154, and if the 20-week cycle brings in a lot of weakness, then we could go down to the .618 retracement level of 1139. Remember, these are only potential targets, and it is up to the market to decide where it wants to go, something that many analysts tend to forget.
If we don't get a decent rally in the next few days, I may stop paying attention to the 9-month cycle. It has been very unreliable in the past couple of years, and since its low occurs regularly 10-12 weeks after the 40-week cycle, it may only be a harmonic of that cycle. Those who are familiar with acoustics know that primary vibrations also produce harmonics. This is well-know in the music field. But it probably applies to the stock market as well, since market cycles are probably caused by energy vibrations. There is also the possibility that certain "cycles" are formed by the combination of other cycles which happen to produce a secondary effect which happens to look like a legitimate cycle. Dewey addresses this phenomenon in his book Cycles, the Mysterious Forces that Create Events and cites examples of what appears to be a legitimate cycle lasting for years and then fading, sometimes returning at a later date and sometimes disappearing forever. So we'll have to see if the 9-month rhythm persists and returns to its former degree of vitality, or if it is no longer effective.
One should also keep in mind that cycles are not the only natural forces which affect the stock market. Or, more accurately stated, they come in different manifestations. "Conventional" cycles are measured from low-to-low, but Gann's time cycles, which often use the same time measurements as the conventional cycles, can be measured from low-to-low, low-to-high, high-to-high, or high-to-low. And you also have Fibonacci time ratios to contend with. The time definition for a market reversal is dependent on all of these factors which sometimes occur simultaneously, and sometimes not. For instance, the next 20-week cycle low will occur not only in conjunction with the low point of the next short-term trading cycle, but with converging Fib. Ratios. All these factors make the third week in February a particularly important date to watch.
A brief analysis of other markets:
Gold and the Dollar: The latest statistics on the shorting activity of the commercial traders (1/25) show that they are expecting some more consolidation in the price of gold before it falls further. It could also mean a decent rally, as the statistics show that the current level of shorting normally results in an up trend which can last several weeks. This would mean that the dollar is expected to expand its base and re-test its lows in the next few weeks. The longer the base, the bigger the move out of the base, and this is still expected to be base-building, not a resumption of the downtrend.
For the long term bears on the dollar, one thing to remember is that it is still the only currency which really qualifies as the world's reserve currency, and this will -- eventually -- place a floor under it, which could very well be now!
Oil: As mentioned above, the price of oil appears to be making a short term top, but could spend more time top-building with rallies to 50 or slightly above. If this happens, it could keep the markets at bay for a while longer, but if it decides to come down right away, it would have the opposite effect and help support a rally.
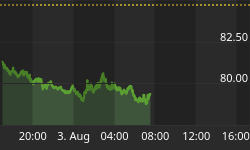
Charts
The charts provided this week are those of the SPX and of the NASDAQ 100. We will concentrate on looking at the short term down trend which started in early January within the context of the intermediate- term trend which started in 8/04, to see if there is any sign of a short-term reversal about to take place, and what must happen to confirm this.
First, on the daily charts, you will notice that the intermediate up channel is well-defined. It has already been broken on the NASDAQ 100, and the lower trend line is supporting prices for the SPX. If that line is broken, it's no big deal, since it would only mean that the trend is probably shifting to a more shallow slope. But it would extend the corrective move and prolong it.
The next thing to look at is the position of the indicators below the price chart. Note that they are trying to get back into an up trend, which means that the correction could be over, or nearly over. What is still lacking is some clearly defined positive divergence, and this means that we could see additional consolidation of prices before reversing the trend.
Turning to the hourly charts, notice that the down channels are well-defined. (Note: There was bad data on the NASDAQ 100 which I could not correct, so I used the QQQQ chart instead. Same pattern.)
On the SPX 2-hour chart, the channel is drawn using two different techniques; Andrews pitchfork (solid lines) and a conventional method (dashed lines) which connects tops and draws a parallel line across the lows.
You will notice that although the steeper channel lines are being challenged and ready to be penetrated, the top of the dashed channel is still quite a ways away and will have to be penetrated before we can confirm an end to the correction.
The QQQQ hourly chart tells the same story as the SPX 2-hour chart.
Turning to the hourly indicators, note that they are not yet in the configuration which would call for a solid low to be in place. Although the divergence with 1/25 is obvious, we probably need to do a little more work in the move which started down on Friday.
Note: The charts provided are courtesy of "My Trader", Fongan Technology at http://www.fongan.net/mt/.
This is a terrific software package that you can download and use for free in the delayed version. If you want real-time, it will cost you about $50.00 a month. This was brought to my attention by one of our readers and I am very grateful for it.


SUMMARY:
The correction which started from the1217 level in early January on the SPX may have run its course, but this will have to be confirmed by future market action. The period which extends from the present to the 3rd week in February is going to decide if we reverse right away, continue to build a base, or go lower.
There you have it! From here, the market can either go up, sideways or down! Terrific technical analysis! Unfortunately, there are times when markets go through a murky period, and this is one of them. Like fog which limits visibility, it's only a temporary condition, and you have to wait until it clears up!
P.S.
Beginning on January 1, 2005, upon request, readers not previously enrolled will be entitled to the daily market comments FREE for a 6-week trial period. After that time has expired, they can choose to subscribe on a yearly or quarterly basis. Full details are available on the website "SUBSCRIBE" section, including a choice of yearly or quarterly subscription terms.


