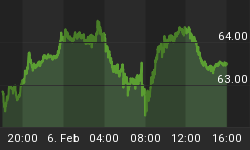
As summed up by Reuters below, the situation in Greece remains fragile:
Radical Leftist Alexis Tsipras began efforts to form a Greek government on Tuesday by renouncing the terms of an international bailout and threatening to nationalize banks in a statement likely to reduce his chances of success. His uncompromising stance may lower already slim chances of forming a coalition by scaring off the former ruling parties New Democracy and socialist PASOK, while further unsettling jittery investors.
The market has reached levels where further deterioration may call for some defensive moves. As the table below shows, the CCM Market Models remain perched on the bullish/neutral line. The risk model reading of 50 means 50% of the signals side with the bulls and 50% side with the bears.

The chart below is an updated version of the one covered in a May 7 video. RSI closed above 50 on Monday; it remains perilously close to a bearish cross. Note the trend in the relative performance of stocks (SPY) to bonds (IEF) after a weekly RSI close below 50 - bonds did better than stocks, which is what the falling ratio tells us.

While the chart of the S&P 500 below looks complex, the concepts are easy to follow. The two red arrows near point A show where the downward-sloping pink trendline acted as resistance in the past. The blue arrow near point B shows the same line is trying to provide support near 1,357. Point C shows the green 50-day moving average with a flat slope. If the slope turns over, it indicates a possible shift in the intermediate-term trend. If 1,357 does not hold, points D and E highlight the next levels where buyers may step in.


