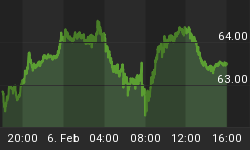
Is the "countertrend" rebound over?
It depends if the EUR catches a multi-day bid.
Yesterday I posted the monthly chart in order to find longer-term pivot zones that could act, at least, as a short-term support above the May 2010 low at 1.1874.
We have only 3 numbers:
- 1.2327 = May 2010 low
- 1.2130 = 0.382 retracement of the move from the 2000 lows to the 2008 top.
- 200 m MA = 1.2028
Today, so far the lod = 1.2355
I have already mentioned that I am clueless regarding how to label the down leg off the May 1 lower high. In the daily time frame we could make the case of a 5-wave down leg but it is not an orthodox one. It is unusual to have such an extended first wave. But at today's hod the fifth remains shorter than the third in compliance with EW rules.
After such "carnage" it is obvious the EUR is extremely oversold and I guess that there must be a huge short open interest, hence a short squeeze is something possible.
If price is able to maintain today's hod the first resistance is at 1.2495 then the 10 d MA
If the down leg from the May 1 high is completed then price could rebound towards the 0.382 retracement at 1.2708, where we also have the 20 d MA.
Clearly without "news" such a "bullish" short-term scenario is probably science fiction.
So lets wait for today's eod print.
Lets go to the SPX chart.
Yesterday's down leg sparked extreme readings in both the TICK and TRIN that could be suggesting some exhaustion in the selling side, in addition, the down leg so far cannot be counted as impulsive and the price internal structure from the May 18 low still has a higher low therefore we cannot rule out that price could still be involved in an unfinished corrective pattern, maybe shaping a bearish flag if price has more business to the upside.
Hence today holding yesterday's lod at 1310.76 is a MUST in order to extend the rebound towards the target box = 1340 - 1353.39.
Therefore, despite it is not clear yet that the corrective EWP from the May 18 low is over, I am 100% confident that the larger EWP from the April 2 top requires one more large down leg, a wave (C), with a possible target in the range 1258-1207.
For the immediate time frame we have to monitor:
- The McClellan Oscillator, which yesterday's dropped below the zero line. But the 5 d MA is still pointing up

- VIX: Tuesday's Inverted Hammer at the trend line support proved to be an inflection point. VIX jumped almost 15% with a huge gap leaving a white Marubozu. Usually, a small range body follows this candlestick. Clearly the expectation of a larger rebound of SPX will depend upon if VIX does not achieve an eod print above 24.62.
AAPL is probably one of the few bright spots. The short-term pattern remains bullish, in addition there is a potential Inverted H&S.
There is plenty of overhead resistance. The first huge obstacle is at the gap 1 = 581.82 then the 50 d MA.
To sum up:
- Price is involved in a corrective countertrend rebound
- New lows will follow.
- The corrective pattern may not be over.
- But an EUR bounce is needed and AAPL has to close the gap at 581.82


