


It is a fact that internal structure of the pullback off the March 16 top of the DOW or from the April 2 top of the SPX cannot be considered impulsive, therefore the US equity indices have not established a major top, hence the June 4 low has to be a wave (A).
And it is also a fact that the internal structure of the current rebound from the June 4 low is also corrective, therefore we know that the corrective pattern is not over yet, hence price is unfolding a wave (B).
What is not clear is if the assumed Double Zig Zag wave (B) is about to be completed or if it is completing the wave (a) of the second Zig Zag. The latter option would have a better look. But since this is not a guessing game, the next decline will give us clues about whether the trend has reversed to the downside or if price has more business to the upside.
If price is unfolding the second Zig Zag off the June 16 higher low then the 50 d MA should not be breached.

Therefore the logical conclusion is that price is expected to trace at least a 3-wave down leg off the nominal highs, hence once the wave (B) is completed there should be at least a pending wave (C) down which could establish an important bottom.
This scenario keeps on track my preferred long-term count that calls for a wave (X) in progress off the November 2008 low, which is unfolding a Double Zig Zag. If this count is correct price is tracing the wave (B) of the second Zig Zag.

If price is unfolding a Zig Zag from the SPX April 2 top then the target for the wave (B) should be located in the range 1248 - 1207
Once the wave (B) is in place the last wave (C) up will establish a major Top.

Regarding the short-term price action of SPX, even though I believe that a pullback is imminent I am inclined to expect one more up leg with a final target in the range 1389 -1406, as long as the 50 d MA = 1340 is not breached.

In the technical front I will be monitoring the McClellan Oscillator which is now extremely overbought but with no indication yet of a reversal. A bearish cross of the short term MA will be warning that the selling pressure is accelerating.

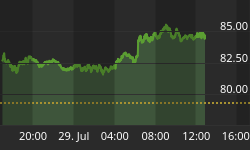
VIX is probably the best indicator in signaling trend reversals, and often this is accomplished by unfolding wedges. Here we might have one in progress. Tuesday´s Doji in addition to an extremely oversold Stochastic are suggesting that at least a bounce is coming.

In the Agenda we have:
Tomorrow: ECB meeting.
Friday we have the often price shocker mover NFP
Next Monday AA kicks off the earning season.
And on July 13 I am out of here for at least one-month (maybe even more) HOLIDAY: -D


