


The NFTRH bullish stance (Dumb Money Sold in May and Went Away) from late May has proven correct. I write that even as I confess to having had moments of doubt about my own analysis in a noisy June that saw US and global policy maker jawbones (and actions) going into hyper drive.
I had been responding to the Ticker Sense blogger sentiment poll (with respect to the market's status over the coming 30 days) as 'Biiwii, Bullish' for several weeks in a row until this week, when the response down-shifted to 'neutral' due to several gathering indicators that imply at least a short term top, coming soon. I lean toward this being little more than a healthy correction in an overall constructive market for most of the balance of 2012. That is just a 'lean' at this juncture.
But it is a lazy summer holiday week, and what better time to drop the nuts and bolts macro market analysis in favor of some simple sector updates? This post will be uncharacteristically light by biiwii standards, which I think can sometimes feel like they are bashing readers over the head with hard core ratios and macro interpretations.

First up is a sneaky US Housing index (HGX) breaking above important resistance by weekly chart. HGX plunged below the supportive weekly EMA 30 at the end of May and promptly reversed back above it into its eventual breakout above the 2010 high. The only negative on this chart is the broadening top formation. Initial breakouts often fail on the first try, so this should be factored in. Critical support is the rising weekly EMA 30.

The last time the GKX Agricultural index jerked the weekly Bollinger Band impulsively upward the resultant decline was relentless as it sought new lows. That is not to say it will work out the same way this time around, but the idea of 'if you have profits on a play that included plenty of hype about droughts and crop damage, you might think about harvesting them (so to speak)' is in play. An NFTRH subscriber who is a retired Meteorologist advised that he is doing so. For its part, NFTRH had been charting the bottoming process in Agriculture fund DBA, along with several individual components and in full disclosure, I failed to initiate a trade in this area. Back to the chart, important support is highlighted in green. It should hold or the fallout is going to be ugly.

The Global X Lithium fund is one I did not fail it initiate as the NFTRH diversified Model portfolio added it right at the lows just above 13. Lithium is a key component in alternative energy due to its excellent energy storage capabilities. The weekly chart looks good, but but LIT is now bumping against a thick cap of resistance. Support for this ETF would come into play at around the weekly EMA 30. I am going to take a well earned profit here, as advised to subscribers in a somewhat wide ranging macro market email update earlier this week.

Finally, let's wrap up this odd combination of markets with a look at the Nasdaq 100 trading vehicle, QQQ. That is a nice chart. It is also a member of the NFTRH Model portfolio and given the portfolio's mission to hold for intermediate cycles, I may forgo taking profits here in favor of evaluating the nature of any coming corrective activity. The target off of the Inverted Head & Shoulders pattern is higher, but the weirdly up-sloped neckline could provide the spark for a reaction of some sort. At the moment, this chart looks too healthy to sell despite my view that odds of correction are rising.
As usual, all analysis is subject to the daily and weekly revisions forced upon us whether we like or agree with them or not. We do not run the markets. We just manage risk and try to capitalize as opportunity presents.
I found this relatively lighthearted post enjoyable and will look forward to doing more like it in the future. I started out as a regular chart guy after all, before going deeper into the weird ratio charts, Treasury bond markets, the inflation/deflation debate and of course the precious metals sector, which is quite a mental load in and of itself.
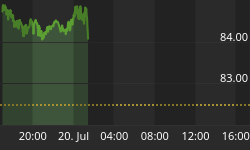
The above are not recommendations, they are merely a snapshot into a few areas of the market. Others sectors will be reviewed as we move forward.


