


Economic weakness is intensifying globally. What could happen to the U.S. markets?
U.S.: How long will the decline last?
External demand is decreasing. Domestic orders are fading. For the first time since 2009, the manufacturing index ISM fell below 50 to 49.7 from 53.5 the previous month. The move was broad-based. New orders, an anticipatory indicator, slumped more than 12 points to 47.8, indicating weakness in the sector might continue. World economies are not trending. In Europe, the June PMI remained below 50, as it has for eleven straight months. In China, it fell to 48.2 during the same month. Institutions are seeing the storm coming and are printing more money. Last week, for the second straight month, China's central bank cut the one-year lending rate by 0.31% to 6%. The Bank of England will increase the size of its purchase programme by GBP 50 billion to GBP 375 billion. The European Central Bank (E.C.B.) cut rates by 25 basis points to 0.75%.
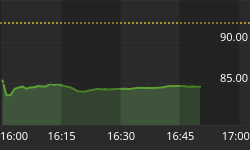
Numbers are no longer adding up. For the third month in a row, non-farm payrolls fell below 100,000. In June, only 80,000 jobs were created. As a result, Quantitative Easing Three (Q3) remains a probable option. The three month average declined to 75,000 in June from 226,000 in March. The private sector created 84,000 jobs, the poorest performance since August 2011. In reality, the unemployment rate remained unchanged at 8.2%. However, the rate including part-time and discouraged workers rose from 14.9% in May to 16.2% in June. What will happen now? The unemployment rate is expected to bottom at around 8.0%-7.8% and then climb toward the highs for the third and final wave. If history repeats itself, this should happen in 2012 or 2013. Incertitude is mounting. The S&P 500 index is bouncing against the resistance at 1380. It corresponds to the higher Bollinger band in the daily chart. The next target could eventually be 1400. A breakout failure could take the price to 1300/1260.
Europe: Was it too little?
As expected, the E.C.B. cut rates by 25 basis points last week to 0.75%, the lowest level in history. The move was just a drop in the ocean. In fact, 50 basis points were preferred by the markets. This year, recovery will be slow and mild. The G.D.P. has likely contracted below zero in the second quarter. Another cut is possible in September. In reality, the institution has little ammunition left. Reforms must take place. The Eurogroup will meet on July 9 to lay out the details of last month's Summit. Apparently, Germany is now supporting a banking union and a more flexible firewall system. In addition, European heads of state showed their intention to end the perverse cycle between governments and banking risks. Action must now follow words. A decline of EUR/USD 1.20/1.18 is still on the cards.
The next few weeks are critical. Keeping an eye on commodity prices could help interpret market action. Raw material prices shrink and expand along with economic trends. Following the slowdown in the so called "emerging markets", the C.R.B. index (Commodity Research Bureau) has been in a downtrend since mid-2011. It met with good support at 500. The next target could eventually be the low at around 400. In the past, the index has shown the tendency to top/bottom every 4-5 years. The last bottom was registered in 2008. Gold is oscillating between 1650 and 1550. The RSI indicator on the weekly chart is showing oversold conditions. Nonetheless, the level of 1670 must first be cleared for higher prices. A breakout failure could take prices to 1500 and eventually 1400.


