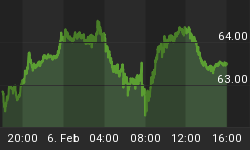
The predicted parabolic rally in the 10-year Treasury Yield Index (TNX) has transpired since my previous commentary on interest rates. The exhaustion of the previous short-term decline was discussed in the Feb. 11 commentary as a short-term buy signal was flashed by the "channel buster" referenced in part 1 of this commentary.
Coming off its floor at the 4% area the TNX has rallied in near-vertical fashion up to the 4.3% level, a sizeable jump in percentage terms in only a few days time. This is not surprising given for how many weeks the yield on the 10-year note was held down against the recent imbalance of the yield curve.
To a very large extent, year 2005 will most likely be the year of the yields. Investor focus is already shifting to the importance of bond as well as stock yields. Then there's the Fed Funds rate which of course is always a major point of investor concern. The Fed really has its work cut out for it this year as it tries to re-balance the financial markets from the overheated condition of 2003-2004 and it will most likely try to contain the interest rate from getting too high, although the natural tendency right now is for yields to rise, short-term, after being forced to unnatural lows for so long.
Business Week recently articulated this conundrum facing the Fed by pointing out that the Fed will have to confront two major questions about its goals for monetary policy: What policy rate constitutes a neutral rate, which neither helps nor hinders growth? And when might the Fed have to move policy into the restrictive zone, raising rates so that economic activity begins to feel the pinch, in an effort to preempt building inflation pressures.
Certainly the latest Producer Price Index (PPI) statistics released last week added credence to the argument in favor of raising rates. The latest rally in the TNX also reflects this concern. Observes Business Week, "Usually by the fourth year of expansion, the Fed is raising rates in an effort to choke off budding price pressures resulting from superhot demand, overextended factories, and tight job markets..." Business Week adds that a major problem facing the Fed is that "No one knows for sure what constitutes a neutral funds rate."

You can clearly see this in the updated 10-year T-note (TNX) chart shown above. In my previous article over a wee ago on the interest rate outlook we looked at the old parabolic configuration and noted that the 4-month parabolic dome was in the process of expiring and would soon give way to a fresh, developing parabolic bowl. Since then the dome has indeed been broken while the bowl has pushed prices to higher levels with further upside potential to at least the recent trading range high at 4.4% before strong resistance is encountered. This is a testimony to the value of parabolic analysis as it is an extremely useful tool for predicting short-term turning points as well as following intermediate-term trends.


