


During the week-end, we wrote: "we want to analyze two different scenario:
- the market finds some support on Monday (around current levels) and climbs up to our target zone
- the market is not able to move into our target and breaks through our warning area (see chart)"
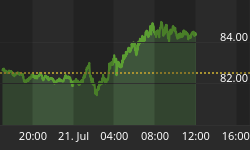
You can see on the Sigma Whole Market Index (see below) that the market closed:
- below our "warning area" (orange box)
- below the uptrend channel
- Thursday's top looks like a double top. It willbe confirmed if/when we decline below the horizontal purple line on the chart

Moreover, our Sigma Trend Index is now in negative territory (at -3').
The Swing indicator is at '2' for the second consecutive day. This tells us we are probably in presence of an impulsive move to the downside.

Looking at our Breadth Index, we don't get any new information from this indicator, but the negative divergence confirmed on Friday is still in place (higher high on price (blue line), but lower high on Breadth (red)).

Conclusion:
We don't like this kind of situation where everything looks so clear, where everything goes in the same direction.
But the market went through all our limits, and we consider now there is a high level of probability (~=65%) that the massive decline is on its way.
In this context, we decided to open a short term position (to the short side) on the NDX at 2587.15.
We would not be surprised if the market tries to bounce back on Tuesday's morning, retesting 2605 on the NDX and 1356 on the SPX.
If the market closes below the horizontal purple line (see top chart) on Tuesday or on Wednesday, we will consider that the probability of our scenario becomes "very high" (~= 80%).
For those of you interested in our intraday move, you can visit our site during the day: we post all our trades in real time. You can also subscribe to our twitter account (@SigmaTradingOsc), it is free and you are updated on our latest view/trades.
Current positions:
Medium term positions:
- short 2 SPX at 1336.99
- short 1 NDX at 2578.46
Short Term positions:
- short 1 NDX at 2587.15


