• 619 days Will The ECB Continue To Hike Rates?
  • 619 days Forbes: Aramco Remains Largest Company In The Middle East
  • 621 days Caltech Scientists Succesfully Beam Back Solar Power From Space
  • 1,021 days Could Crypto Overtake Traditional Investment?
  • 1,025 days Americans Still Quitting Jobs At Record Pace
  • 1,027 days FinTech Startups Tapping VC Money for ‘Immigrant Banking’
  • 1,030 days Is The Dollar Too Strong?
  • 1,031 days Big Tech Disappoints Investors on Earnings Calls
  • 1,032 days Fear And Celebration On Twitter as Musk Takes The Reins
  • 1,033 days China Is Quietly Trying To Distance Itself From Russia
  • 1,034 days Tech and Internet Giants’ Earnings In Focus After Netflix’s Stinker
  • 1,037 days Crypto Investors Won Big In 2021
  • 1,038 days The ‘Metaverse’ Economy Could be Worth $13 Trillion By 2030
  • 1,039 days Food Prices Are Skyrocketing As Putin’s War Persists
  • 1,041 days Pentagon Resignations Illustrate Our ‘Commercial’ Defense Dilemma
  • 1,041 days US Banks Shrug off Nearly $15 Billion In Russian Write-Offs
  • 1,044 days Cannabis Stocks in Holding Pattern Despite Positive Momentum
  • 1,045 days Is Musk A Bastion Of Free Speech Or Will His Absolutist Stance Backfire?
  • 1,045 days Two ETFs That Could Hedge Against Extreme Market Volatility
  • 1,047 days Are NFTs About To Take Over Gaming?
Lending: The Good, Bad, And Ugly

Lending: The Good, Bad, And Ugly

Aristotle said, “The most hated…

Tesla Struggles To Compete In European Market

Tesla Struggles To Compete In European Market

Tesla continues to catch the…

Market Sentiment At Its Lowest In 10 Months

Market Sentiment At Its Lowest In 10 Months

Stocks sold off last week…

  1. Home
  2. Markets
  3. Other

What Do You Make of These Huge Imbalances?

Sometimes it is good to ponder.

Like now, when there are some large discrepancies that are very hard to explain. For instance, the huge differential between the indexes are something that investors should at least be aware of.

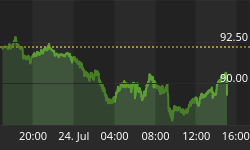
Take a look at the chart below and see what we mean ... here is the verbalexplanation of what it says:

"The indexes listed since the beginning of the year are shown on the chart. The most reasonable historical average to reflect on is 7.33% on the DJI during an election year. Now, that is an average, so to get an average, there has to be percentages above and below that percentage.

But, how much can one index vary from the DJI without being out of balance? I don't have the answer for that, so let's look at it logically and see what we get. For instance, the NDX is at 14% (year-to-date) and the DJI is at 5.47%, so the NDX is 256% beyond the yearly return of the DJI so far.

I would expect 100% to be out of balance, but 256% has to be an extreme where the NDX has gotten too far ahead of itself relative to the DJI. So what is the bottom line? It is, that given the chart showing the current relationships of different indexes (or ETF), that the skew is so extreme that it can (at best) be described as a mixed condition.

Election years often see money stimulation, but the market is also a great balancer of extremes. It may take time, but eventually the market will come back to normality and common sense.

Not a subscriber yet? Give it some thought and see some very valuable datathat you will never find anywhere else.


Back to homepage

Leave a comment

Leave a comment