• 407 days Will The ECB Continue To Hike Rates?
  • 408 days Forbes: Aramco Remains Largest Company In The Middle East
  • 409 days Caltech Scientists Succesfully Beam Back Solar Power From Space
  • 809 days Could Crypto Overtake Traditional Investment?
  • 814 days Americans Still Quitting Jobs At Record Pace
  • 816 days FinTech Startups Tapping VC Money for ‘Immigrant Banking’
  • 819 days Is The Dollar Too Strong?
  • 819 days Big Tech Disappoints Investors on Earnings Calls
  • 820 days Fear And Celebration On Twitter as Musk Takes The Reins
  • 822 days China Is Quietly Trying To Distance Itself From Russia
  • 822 days Tech and Internet Giants’ Earnings In Focus After Netflix’s Stinker
  • 826 days Crypto Investors Won Big In 2021
  • 826 days The ‘Metaverse’ Economy Could be Worth $13 Trillion By 2030
  • 827 days Food Prices Are Skyrocketing As Putin’s War Persists
  • 829 days Pentagon Resignations Illustrate Our ‘Commercial’ Defense Dilemma
  • 830 days US Banks Shrug off Nearly $15 Billion In Russian Write-Offs
  • 833 days Cannabis Stocks in Holding Pattern Despite Positive Momentum
  • 834 days Is Musk A Bastion Of Free Speech Or Will His Absolutist Stance Backfire?
  • 834 days Two ETFs That Could Hedge Against Extreme Market Volatility
  • 836 days Are NFTs About To Take Over Gaming?
Another Retail Giant Bites The Dust

Another Retail Giant Bites The Dust

Forever 21 filed for Chapter…

What's Behind The Global EV Sales Slowdown?

What's Behind The Global EV Sales Slowdown?

An economic slowdown in many…

Zombie Foreclosures On The Rise In The U.S.

Zombie Foreclosures On The Rise In The U.S.

During the quarter there were…

  1. Home
  2. Markets
  3. Other

98.9%

Anyone who has been following my work over the past three months knows, I have been keeping a close eye on the Aussie as it works its way across the SPX topping pattern from last year. It has been a moving target to appraise, but did point out in May where the lows would be made in June and now appears to be pointing to another inflection point here in August. For a quick explanation of the methodology used in this comparison, see Here.

Using the 2011 SPX model's proportion of a 98.9% retracement of the intraday high would generate an equivalent target in FXA of 105.90. Considering FXA reached an intraday high of 105.73 today, puts us in very close proximity of finding the next pivot - which would be lower. The same could be said of the SPX.
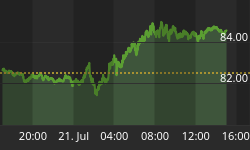
2011SPX versus 2012 Australian Dollar

2011 SPX daily

2012 Australian Dollar Daily

2011/12 Australian Dollar and SPX

2011/12 SPX Daily

Fractals in motion.

2011 SPX and 2011/12 FXA

Considering that the respective markets are positioned so close to where the pattern would be considered broken (>100% retracement), presents an excellent opportunity to position yourself on the short side of this market. 98.9% is a very strong move - but it's not 100%.


Back to homepage

Leave a comment

Leave a comment