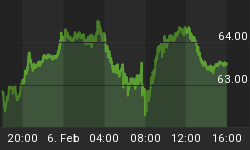
To say that the markets have been rather erratic on a day-to-day basis of late would be an understatement. However, despite the rotting long-term fundamentals surrounding the slow-motion implosion of intractable debt around the world, compared to the rollercoaster ride last summer, the current season has been a walk-in-the-park with an upside bias to boot.
Given the bipolar price action, one would assume it virtually impossible to draw lines in the sand, which impart specific point values and price targets effectual in capturing such erratic moves.
Behold the 30-minute price chart of the Dow rendered from the archives of our Near Term Outlook publication. Amid the chaos following the recent print low of 12492.33 in mid-July, we cited two upside price targets worth a combined 799 Dow points at 13066 and 13116 respectively.

On July 30, the Dow set a pivot high of 13128.48, capturing our two bullish upside price targets handily.
Then, on Wednesday August 1, we set another line in the sand. This one cited 260-pts of downside upon its breach with a target of 12800.
As illustrated, within 24-hours, the Dow plunged marginally in excess of said 260-pts, and tagged the downside price target of 12800 upon setting its pivot low at 12780.42 prior to Friday's rocket launch north of 13133.
All told, in the past two weeks, we have identified and captured over 1000 Dow points amid a market that has no apparent clue as to where it belongs.
So, where do we go from here?
Well, according to our chart, 13462 appears reasonable for an upside target however, a 470-pt bearish line in the sand may have something to say with regard to such near term prospects.
As we head into Monday, the 12839 level defines boundary to this bearish line in the sand, and by Wednesday, the line narrows its breach point by 100-pts at 12939.
To follow such illustrations regularly, one needs only to support such effectual efforts with a modest subscription to the Near Term Outlook.
Let the games continue, and let the most prepared and disciplined take home the most gold.


