


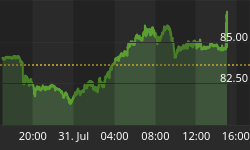


Earlier this week, the S&P 500 managed to better its April high, as suggested more than two months ago in our discussion about V-bottoms. Because stocks left behind a V-bottom at a weekly cycle low, probability favors seeing the June low fail as stocks move into their next weekly low, which should also constitute a yearly cycle low.
Indeed, the macro environment is highly conducive to a significant correction. Europe's efforts to delay the day of reckoning over their debt woes is coming to a head. In mid-September, the German supreme court will vote on the constitutionality of the ESM. Greece and Spain continue to fall under a tremendous amount of fiscal pressure. The U.S. is still nursing am employment problem while manufacturing statistics suggest contraction. China is fervently fighting a recession which is likely bigger than official figures reveal.
But we all know that macroeconomic factors, at times, take many months to express themselves in terms of stock prices. So let's turn to some technical analysis for a better sense of timing. Is the market ripe for a correction technically?
Beginning with sentiment, smart money confidence, as published by sentimentrader.com, stands at 42%. While this reading is not extreme, big fish confidence is already lower than the level associated with the commencement of last year's yearly cycle decline. A similar situation exists with the intermediate-term score:

As you can see, the reading is pushing into bearish territory, but is already beyond the level associated with the commencement of last year's yearly cycle decline. Furthermore, bullish pecent on the S&P 500 is displaying a hugely-bearish divergence.

With only one previous example, declaring that stocks will also roll over into a 4-year cycle decline would be a tenuous claim. Nevertheless, the sharp divergence does add credibility to the outlook for a significant correction. Many fewer stocks are participating in the most recent high than in the April high. Along those lines, we can see that the SPX is nearly alone in its trek higher.

To borrow a second chart from Tiho over at The Short Side of Long, we can see a huge disparity in tech stock participation, as well.

In fact, the last several weeks of rally actually witnessed a decrease in new highs, an immense sign of weak participation.
Obviously, none of these clues reveal whether this week's brief foray above the April high will mark a peak. Indeed, seeing the market spend only an hour above the previous peak would be a bit odd. However, action and internals continue to support the prognostication of two months ago: that stocks would manage to break the April high as big players distributed shares. The market should then feel out a peak and roll over into a typical autumn crisis.


