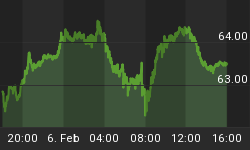
There is a direct correlation between the stock market does and what Institutional Investors do here ...
A direct correlation with what???
The answer is that "there is a direct correlation with the Selling Activity of Institutional Investors and what the market does. To go against what Institutional Investors are doing usually means pain and losses for individual investors.
For example, today's chart show's the daily Institutional Investor Selling Activity compared to the stock market. Spend a few minutes and note how the movement of the New York Stock Exchange has a direct correlation with the movement of the Institutional Selling graph at the bottom of the chart. (Realize that there is an inverse relationship between the Institutional Selling and the market's movement. It is common sense ... if the selling goes down, the market goes up. If the selling goes up, the market moves down.
But that is not the reason we are showing you the chart today. The reason has to do with what kind of Selling Institutional Investors have done for the past 7 days.
If you look at the chart, the trend has been sideways for 7 days. No up trend or down trend in selling activity. This means Institutional Investors have a Neutral stance and that they are waiting for the outcome of some kind of news or event before a new trend starts in their selling or lack thereof. So, given the above, this is an alert condition for investors. (Reference: This chart is posted and updated every day in Section 3 Chart 1 of the Standard subscriber site.)


