


The good news is:
• All of the major broad based indices were up last week in spite of a negative seasonal bias.
The negatives
The market had been weak since mid September. The weakness showed up in prices, but not the breadth indicators. Since the mid September high the secondaries have been underperforming the blue chips and that underperformance continued during last week's rally.
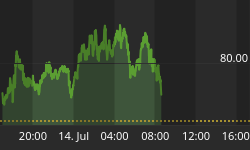
The chart below is from FastTrack (http://www.fasttrack.net/). It covers the past 6 months showing the S&P 500 (SPX) in green and the Russell 2000 (R2K) in red. A relative strength indicator called Accutrack is shown as a histogram in yellow.
Accutrack has been falling since mid September and continued falling during last weeks rally. The secondaries usually lead the blue chips.

The positives
Most of the seasonal weakness is behind us and we got through it with no significant gain in the number of new lows.
The chart below covers the past 6 months showing the SPX in red and a 40% trend (4 day EMA) of NYSE new highs divided by new highs + new lows (NY HL Ratio) in black. Dashed horizontal lines have been drawn at 10% levels for the indicator; the line is solid at the neutral 50% level.
NY HL Ratio has held above 90% for a month.

The next chart is similar to the one above except it shows the NASDAQ composite (OTC) in blue and OTC HL Ratio, in red, has been calculated from NASDAQ data.
OTC HL Ratio has held just a little below 80%, very strong.

Seasonality
Next week includes the first 5 trading days prior to the 2nd Friday of October during the 4th year of the Presidential Cycle.
The tables below show the daily return on a percentage basis for the 5 trading days prior to the 2nd Friday of October during the 4th year of the Presidential Cycle.
OTC data covers the period from 1963 - 2011 and SPX data covers the period from 1953 - 2011. There are summaries for both the 4th year of the Presidential Cycle and all years combined. Prior to 1953 the market traded 6 days a week so that data has been ignored.
Average returns are negatively skewed by a really bad week in 2008, but, omitting 2008, average returns have not been attractive.
Report for the week before the 2nd Friday of October.
The number following the year is the position in the Presidential Cycle.
Daily returns from Monday to 2nd Friday.
| OTC Presidential Year 4 | ||||||
| Year | Mon | Tue | Wed | Thur | Fri | Totals |
| 1964-4 | 0.07% | 0.19% | 0.30% | 0.35% | 1.04% | 1.94% |
| 1968-4 | -0.12% | -0.53% | 0.00% | 0.42% | -0.35% | -0.58% |
| 1972-4 | 0.30% | 0.40% | -0.35% | -0.54% | -0.53% | -0.73% |
| 1976-4 | 0.02% | -0.78% | -0.80% | 0.67% | -0.28% | -1.17% |
| 1980-4 | 1.33% | 0.08% | 0.51% | 0.18% | 0.13% | 2.24% |
| 1984-4 | -0.37% | -0.20% | -0.32% | 0.59% | 0.56% | 0.27% |
| 1988-4 | -0.05% | -0.05% | -0.71% | 0.24% | 0.29% | -0.28% |
| Avg | 0.25% | -0.11% | -0.33% | 0.23% | 0.04% | 0.07% |
| 1992-4 | -1.12% | 0.94% | -0.24% | 0.82% | -0.59% | -0.18% |
| 1996-4 | 0.26% | -0.86% | -0.18% | -0.08% | 0.91% | 0.06% |
| 2000-4 | -0.16% | -3.43% | -2.22% | -2.96% | 7.87% | -0.90% |
| 2004-4 | 0.53% | 0.16% | 0.79% | -1.14% | -1.47% | -1.13% |
| 2008-4 | -4.34% | -5.80% | -0.83% | -5.47% | 0.27% | -16.17% |
| Avg | -0.97% | -1.80% | -0.53% | -1.77% | 1.40% | -3.66% |
| OTC summary for Presidential Year 4 1964 - 2008 | ||||||
| Avg | -0.30% | -0.82% | -0.37% | -0.58% | 0.66% | -1.39% |
| Win% | 50% | 42% | 27% | 58% | 58% | 33% |
| OTC summary for all years 1963 - 2011 | ||||||
| Avg | -0.02% | -0.27% | -0.10% | 0.21% | 0.56% | 0.39% |
| Win% | 61% | 49% | 50% | 71% | 71% | 59% |
| SPX Presidential Year 4 | ||||||
| Year | Mon | Tue | Wed | Thur | Fri | Totals |
| 1956-4 | -0.04% | -0.50% | 1.39% | -0.06% | 0.41% | 1.19% |
| 1960-4 | 0.20% | 0.15% | -0.13% | 0.78% | 0.53% | 1.53% |
| 1964-4 | 0.45% | 0.06% | 0.01% | 0.28% | 0.21% | 1.02% |
| 1968-4 | -0.01% | 0.04% | 0.00% | -0.43% | -0.11% | -0.51% |
| 1972-4 | 0.26% | 0.08% | -0.45% | -0.82% | -0.63% | -1.56% |
| 1976-4 | -0.13% | -0.77% | -0.25% | 0.55% | -0.95% | -1.55% |
| 1980-4 | 1.86% | -0.55% | 0.50% | -0.46% | -0.57% | 0.76% |
| 1984-4 | -0.34% | -0.28% | 0.27% | 0.41% | 0.86% | 0.92% |
| 1988-4 | 0.06% | -0.11% | -1.42% | 0.45% | 0.10% | -0.92% |
| Avg | 0.34% | -0.33% | -0.27% | 0.03% | -0.24% | -0.47% |
| 1992-4 | -0.71% | -0.10% | -0.72% | 0.87% | -1.25% | -1.90% |
| 1996-4 | 0.27% | -0.39% | -0.56% | -0.31% | 0.87% | -0.11% |
| 2000-4 | -0.49% | -1.07% | -1.62% | -2.55% | 3.34% | -2.39% |
| 2004-4 | 0.32% | -0.06% | 0.67% | -1.00% | -0.75% | -0.82% |
| 2008-4 | -3.85% | -5.74% | -1.13% | -7.62% | -1.18% | -19.52% |
| Avg | -0.89% | -1.47% | -0.67% | -2.12% | 0.21% | -4.95% |
| SPX summary for Presidential Year 4 1956 - 2008 | ||||||
| Avg | -0.15% | -0.66% | -0.26% | -0.71% | 0.06% | -1.70% |
| Win% | 50% | 29% | 38% | 43% | 50% | 36% |
| SPX summary for all years 1953 - 2011 | ||||||
| Avg | 0.11% | -0.21% | 0.12% | -0.10% | 0.18% | 0.10% |
| Win% | 57% | 38% | 47% | 42% | 56% | 58% |
Money supply (M2)
The money supply chart was provided by Gordon Harms. Money supply growth has decelerated modestly.

Conclusion
The seasonal pattern of weakness started a little early and appears to have ended a little early
I expect the major averages to be higher on Friday October 12 than they were on Friday October 5.
Last weeks negative forecast was a miss.
This report is free to anyone who wants it, so please tell your friends. They can sign up at: http://alphaim.net/signup.html. If it is not for you, reply with REMOVE in the subject line.
Gordon Harms produces a Power Point for our local timing group meetings. You can get a copy of that at: http://www.stockmarket-ta.com/
In his latest newsletter, Jerry Minton looks at the Big Picture and asks when the next "secular" bull market will begin, You can read it and sign up for his free newsletter at Alpha's homepage: http://alphaim.net/
Good Luck,
YTD W 13 /L 15/T 12


