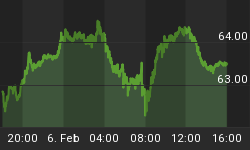
M-3 rose another $16.0 billion last week, and is up $59.2 billion over the last two weeks. That two-week annualized rate of growth is 16.3 percent. Some tightening going on, eh? The Fed jawbones a strategy of monetary tightening by raising short-term interest rates, then does just the opposite by printing hyperinflationary amounts of money out of thin air. They must fear something. Central Bankers in their right minds do not hyper-inflate the economy unless they feel there are extraordinary risks out there that could disrupt markets.
The Master Planners continue to throw fresh Dollars at every economic risk. Just print more money. Just add liquidity to the system. Just devalue the Dollar. Our research indicates that whenever M-3 rises for more than a month, equities rise; and whenever M-3 plateaus or declines for more than a month, equities decline. So, on the surface, more M-3 should be positive for equities. However, at some point the Dollar will devaluate to the point where foreign investors have had enough, dump U.S. financial holdings, and add so much selling pressure that US markets collapse. "When" is the question. The Master Planners seem to believe they can skate through their own personal tenures in office and let the poor slobs who must succeed them deal with the reality of the mess they've created. It is simply an eat, drink, and be merry strategy, for we care not what happens tomorrow. Good for Gold and precious metals, bad for the Dollar and eventually everything else out there.
The trade-weighted U.S. Dollar (shown on the next page) continues its five-wave impulse move lower to complete its Minor degree wave 5 of Intermediate degree wave 5, forming a sustainable bottom. The decline this week was sharp, having the personality of a "three" wave, Minuette iii of 5 down, headed toward the December 31st low of 80.39, and perhaps sinking into the high 70's. It finished the week a mere point above the previous low.
The probability of hitting the 70s is increasing as the Dollar has formed a classic Bearish Head & Shoulders top, with the neckline around 82.50ish. Minuette ii up formed the top of the right shoulder, and this week's decline completed and confirmed the pattern. Confirmation came with a decisive break below the neckline, which increases the probability that the minimum downside target will be reached. The minimum downside target for this pattern is 79ish.
Once a sustainable bottom is reached, a multi-month A-B-C rally for Primary degree (2) up should follow. Once the Dollar breaks out above the upper boundary of the long-term declining trendchannel, it should retrace a Fibonacci percent of the huge decline in its value since early 2000. Since the U.S. Dollar fell about 40 points (33 percent), look for a rally to take it back to somewhere between 95 (.382) and 105 (.618). Continued Fed liquidity pumping will delay this rally.
One scenario that could rally the U.S. Dollar is for interest rates to rise while equities fall. That would put a crimp in the Fed's ability to pump excess liquidity into the system to support equities. Dollars would then become more scarce as folks attempt to liquidate assets to meet margin calls or replace the lost value of equities.
We publish technical analysis newsletters of the major U.S. Equity, Bond, Commodity, Precious Metal, and Currency markets, using multiple tools simultaneously, including Elliott Wave Theory, Supply and Demand, Momentum Measures, Dow Theory, Chart Patterns, Cycles, Sentiment Measures, Fibonacci Ratio Measures for Price and Time turn targets, and Analogs of Current Price Behavior with the Past to name a few.
To Subscribe and receive access to these expanded newsletters, Trader's Corner, and our Proprietary Short and Intermediate-term Technical Indicator Indices, I invite you to visit our website at www.technicalindicatorindex.com and simply click on the How to Subscribe button.

"God is our refuge and strength,
A very present help in trouble.
Therefore we will not fear, though the earth should change,
And though the mountains slip into the heart of the sea;"
Psalms 46: 1, 2


