


Originally published November 11th, 2012.
We exited our short positions in silver for a modest but useful profit when it broke out of its downtrend towards the end of October. It then broke sharply lower on heavy turnover in a move that looks capitulative, but afterwards turned and rose quite sharply over the past week. So the question now is "has it bottomed?" Although the answer to this question is "Yes, it looks like it has", it also looks like it may back and fill for a little while to complete a base pattern before a sustained advance can get underway. The latest silver COT continues to give grounds for caution and warns that the current turn may be the B-wave trap of a 3-wave A-B-C correction. We are aware of this danger and place stops accordingly to protect us from it.
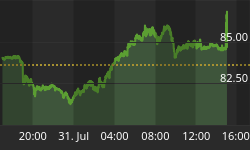
Silver hit the downside target given in the Marketwatch article posted on the site on October 16th, and is showing signs of basing, as we can see on its 6-month chart below. Whereas October is seasonally negative for gold and silver, November is seasonally positive, especially for gold, which is probably why gold has been performing better than silver in the recent past. Thus while gold has been trying to push out of its small base pattern in recent days, it is believed prematurely, silver has not attempted this feat, and looks like it is in the process of marking out a more proportional small Head-and-Shoulders bottom. Action in both metals looked short-term toppy on Friday after the week's sharp rise, so it is reasonable to expect silver to drop back and mark out the Right Shoulder low of the potential Head-and-Shoulders bottom shown on the chart. This pattern could abort of course, if the current turn is the B-wave trap of a 3-wave A-B-C correction, and we will now see why this could be so on silver's latest COT chart.

Given how far silver has dropped back in recent weeks, the Commercial short and Large Spec long positions have not dropped back as much as they should for bulls to be comfortably confident. This is why we have some suspicion that the current turn may be a sucker rally, although one other outcome is a modest rally that doesn't manage to get above the September - October highs. This is the scenario that the current pattern suggests is the most likely.

On the 3-year chart for silver we can see that overall it remains stuck in a large trading range bounded by the nearest support and resistance shown, although the way it has reversed near its 200-day moving average looks positive. This chart makes clear the importance of the resistance in the $35 - $37.50 zone, as this level has turned the price back 3 times already over the past year. If it can succeed in breaking above this resistance level it will be the most bullish technical development since the April 2011 highs.


