


Originally published November 11th, 2012.
We exited our short positions in gold for a modest but useful profit when it broke out of its downtrend towards the end of October. It then broke sharply lower on heavy turnover in a move that looks capitulative, but afterwards turned and rose quite sharply over the past week. So the question now is "has it bottomed?" Although the answer to this question is "Yes, it looks like it has", it also looks like it may back and fill for a little while to complete a base pattern before a sustained advance can get underway. COTs, particularly for silver, continue to give grounds for caution and warn that the current turn may be the B-wave trap of a A-B-C correction. We are aware of this danger and place stops accordingly to protect us from it.
We can see the latest action on the 6-month chart for gold below. Gold didn't quite make it as far down as our earlier defined downside target at $1660 in the vicinity of its 200-day moving average, but reversed at a good point for it to do so, just above this key average. Action last week certainly looks positive, with it rising day after day on good volume, but by Friday it was looking a bit tired with a "doji" forming just beneath its 50-day moving average. This implies that it may take a breather here and back off a little to form the Right Shoulder of a small potential Head-and-Shoulders bottom. This would be a "nice" thing for it do technically, as it would set it up for a strong rise, and it will be nicer still if it does just that and we buy on such a short-term dip. We therefore look to buy or increase positions on a short-term dip towards $1700, say in the $1705 area, with a stop below $1695 to protect us from the C-wave risk mentioned above, or alternatively on a closing break above $1742 if the advance continues, with a closing stop at about $1718, which reduces the risk of a whipsaw - unless that is the dastardly cartel are reading this.

On the 3-year chart for gold we can see that overall it remains stuck in a large trading range bounded by the nearest support and resistance shown, although the way it has reversed near its 200-day moving average looks positive. This chart makes clear the importance of the resistance approaching the $1800 level, as this level has turned the price back 3 times already over the past year. What this implies is that if it can succeed in breaking above this level it should then act as a foundation for a breakout to new highs leading to a major new uptrend.

The latest COT chart for gold shows Commercial short and Large Spec long positions continuing to ease from the extreme levels of a few weeks back which all but prohibited further advance. Positions are not yet at levels which can be described as bullish, but at least there is now room for renewed advance. Other than this observation, the latest gold COTs are not much use in predicting the immediate outlook, although the silver COTs continue to give grounds for caution.

Precious Metals stocks are still in a clearly defined downtrend that began in mid-September, as we can see on the 6-month chart for the HUI index below, and would be buyers should generally wait until we see a clear breakout from this downtrend before moving into the sector, and then quite close stops should be set to guard against the risk that the breakout is false move.

Of crucial importance for gold and silver, and just about everything else, is the outlook for the dollar. It has been picking up in recent weeks, as we had expected, but now it is showing signs that its recovery may be petering out at a somewhat lower level than we had earlier expected. We had earlier figured that the dollar index would rally to a target at about 81.70, close to its high of last January, to complete the Right Shoulder of a Head-and-Shoulders top as shown on its 1-year chart below, and it still could, but the action in gold in recent days suggests that it may be about to top out here, just beneath the zone of resistance shown.

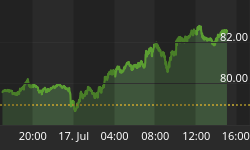
If the dollar rolls over and drops here, in addition to giving the Precious Metals a boost it is likely to trigger a sharp rebound in the broad stockmarket, which is now quite deeply oversold as we can see on the 6-month chart for the S&P500 index below. This was why we hastily took profits in our broad market bear ETFs on Friday.

Although such a rebound may now occur, the longer-term charts for the broad US stockmarket look pretty awful, which is hardly surprising considering the prospect for shriveling corporate profits and the looming Fiscal Cliff, so it the broad market rallies we will probably go back into our shorts.


