


Opening Whisper
This week the FOMC continued the steady increase in the short term Fed Funds rate with another 25 basis point move. Just as everyone thought right? Something was not right, because the markets sold off hard on Tuesday after the announcement. Even with oil moving down dramatically, the name of the game became interest rates not oil. On the subject of interest rates, Peter Schiff has an excellent article about that topic on SafeHaven. (http://www.safehaven.com/article-2787.htm) If interest rates are increasing, then we need to ask ourselves if the reason is because of growth in the national and world economies or if it is due to inflation. Hmmmm, maybe I had better dust off my economic glossary and remind myself of the definition of "stagflation."
Our Trading System - What The Numbers Are Telling Us
An email was sent to subscribers on Wednesday to advise that the market was looking like it might rally a little from this point. Our indicators are still on sell, and have even strengthened the sell signal since last week. The 9x18 Moving Averages have done a bearish cross on our weekly chart of the NDX. The rally is even more likely in the next few trading days given the peak seen this week in the CBOE put/call ratio. (Symbol $CPC on StockCharts.com; using the Simple 10 day MA) See that chart in the Sentiment Section below.
All major indices are definitely oversold and ready for a slight bounce as measured by the Stochastics on a daily basis. The Dow Industrials did break through support at 10,600 as hypothesized in last week's report. The Nasdaq Composite fell below the 2000 level. Both of these breaks portend more bearish trending ahead as we head into the summer doldrums and peak gasoline season.
Our sell signal is maturing and in conjunction with the Put/Call ratio peak this week, the market will likely rally next week to work some bearish fear sentiment out of its system and get back into a greedy mentality. I think it might be wise to reduce our short position here in anticipation of the probable rally. The seasonal factors will likely limit the extent of the rally to a week or two. The intermediate term trend is still bearish and becoming more bearish. Watch the daily stochastic on the Dow Industrials to determine if they want to rally in the face of high oil prices! Rallies in the face of bad news are a sign of strength in the short term.

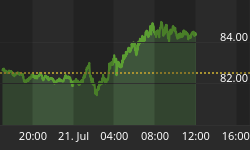
NDX - Chart Model - Thursday March 24, 2005
The markets finished very weak on Thursday in the face of the long Easter weekend.
What Is The Current Sentiment?
Let's take a look at a few sentiment charts to see if there are any changes in sentiment or sector rotation? Following is the Put/Call ratio chart which I like to use to identify rally opportunities in a general bearish trend. This chart identified the start of the significant August 2004 rally. We'll be watching the significance of this week's peak above 1.00 in that ratio.
I know that this following chart is very busy, but it is also very insightful when you study the $CPC 10 day simple moving average peaks against the major market indices. When that blue MA (10) line gets near 1.00, a rally almost is a certainty. We reached that peak this week. On the bottom of the chart I like to compare the $CPC Price Relative to the OEX. This relative ratio helps us see where the peaks occur and where the markets decide to rally after some bearish momentum.

CBOE Options Put/Call Ratio Chart - One Year
The VIX was up only 2% this week! This miniscule rise in the fear index tells us that there is still a lot of complacency in the market. The SPX/VIX ratio (below) is stubbornly high but has stalled and may be starting its decent.

3 Yr Ratio SPX / VIX Volatility Ratio - Nosebleed Territory Breaking Down?
The following Materials/Financial sector ratio chart is confirming a materials uptrend. This trend has resumed this week and is going parabolic. This chart is signaling inflation is coming or, that the only thing worth owning is safe raw materials. Are we entering a time period where bonds, stocks and real estate may all fall in value at the same time?
This trend is good for gold, metals and commodities. Gold mining stocks (Symbols $XAU and $HUI) may get squashed if equities turn down significantly. I like the new ETF for gold, symbol GLD to track the gold (commodity) pricing better.

Material / Financial Sector Ratio - 3 Yr.
Below is the GLD chart. I own some here, but will buy more when that MACD starts to turn up.

3 Year Chart for Gold ETF - GLD
Let's take another look this week at the bank sentiment ratio chart - $BKX / $INDU. (The relative strength between the Philadelphia Bank Index and Dow Industrials)
The weekly MACD on this chart and the 20 Day EMA have turned even more bearish this week after a 3 year up-trend. We didn't get the bounce at the support line. From here it looks like it is diving into the abyss? Ouch!

$BKX / INDU Ratio - Weekly - 3 years
Where Do We Go From Here and How To Listen For the Next Signal?
Listener Summary for the Week
We may have crossed the tipping point this week when the market started coming to grips with increasing interest rates. This has been a significant week. Next week we will find out if the bearish cycle gets interrupted briefly by a short rally. If we don't get that rally next week, then we might see a significant phase shift decline in market valuations before we reach a plateau on which to settle.
The US dollar (Symbol $USD in StockCharts.com) was looking very sad last week. But it has rallied significantly this week. Can the Euro be in more trouble than the US Dollar? Maybe.
The Market is whispering now, but may be getting ready to shout!
Are you listening?
The Market Listener Indicators
| Week Ending | Slo. Stoch. | StochRSI | MACD | ROC | Signal |
| Mar 24, 2005 | Sell | Sell | Sell | Sell | Sell |
| Mar 18, 2005 | Sell | Sell | Sell | Sell | Sell |
| Mar 11, 2005 | Sell | Sell | Sell | Sell | Sell |
| Mar 04, 2005 | Sell | Sell | Sell | Sell+ | Sell |
| Feb 25, 2005 | Sell | Sell | Sell | Sell | Sell |
| Feb 18, 2005 | Sell | Sell | Sell | Sell | Sell |
| Feb 11, 2005 | Sell | Sell | Sell | Sell | Sell |
| Feb 04, 2005 | Sell | Cash | Sell | Sell | Cash |
| Jan 28, 2005 | Sell | Sell | Sell | Sell | Sell |
| Jan 21, 2005 | Sell | Sell | Buy- | Sell | Sell |
| Jan 14, 2005 | Sell | Sell | Buy | Sell | Sell |
| Jan 07, 2005 | Buy | Sell | Buy | Sell | Sell |
| Dec 31, 2004 | Buy | Buy | Buy | Sell | Cash |
| Dec 23, 2004 | Buy | Buy | Buy | Buy- | Buy |
| Dec 17, 2004 | Buy | Buy | Buy | Buy | Buy |
| Dec 10, 2004 | Buy | Buy | Buy | Buy | Buy |
| Dec 03, 2004 | Buy | Buy | Buy | Buy | Buy |
| Nov 26, 2004 | Buy | Buy | Buy | Buy- | Buy |
| Nov 19, 2004 | Buy | Buy | Buy | Buy | Buy |
| Nov 12, 2004 | Buy | Buy | Buy | Buy | Buy |
| Nov 05, 2004 | Buy | Buy | Buy | Buy | Buy |
| Oct 29, 2004 | Buy | Buy | Buy | Buy | Buy |
| Oct 22, 2004 | Buy | Buy | Buy | Buy- | Buy |
| Oct 15, 2004 | Buy | Buy | Buy | Buy- | Buy |
| Oct 08, 2004 | Buy | Buy | Sell+ | Buy | Buy |
| Oct 01, 2004 | Buy | Buy | Sell+ | Buy | Buy |
| Sep 24, 2004 | Buy | Buy | Sell+ | Buy- | Buy |
| Sep 17, 2004 | Buy | Buy | Sell+ | Buy | Buy |
| Sep 10, 2004 | Buy | Buy | Sell | Buy | Buy |
| Sep 03, 2004 | Buy | Buy | Sell | Sell+ | Buy |
| Aug 27, 2004 | Buy | Buy | Sell | Sell | Buy |
| Aug 20, 2004 | Sell | Buy | Sell | Sell+ | Cash |
| Aug 13, 2004 | Sell | Sell | Sell | Sell | Sell |
| Aug 06, 2004 | Sell | Sell | Sell | Sell | Sell |
| Jul 30, 2004 | Sell | Buy | Sell | Sell+ | Cash |
* Note - Our Newsletter is published on Thursday evenings so we make an attempt to "predict" the signal at the end of Friday. You should not base your trading on this or any prediction, but I can trade 10 minutes prior to the close on Fridays (or other days during the week) when I see that one or more of the signal indicators have changed signals. This is particularly important if I am going to a CASH position in order to preserve capital. The above table shows the results of the WEEKLY - FRIDAY SIGNALS with the exception of the latest week, which only shows the END-OF-DAY THURSDAY SIGNAL POSITIONS. The latest signal position may change in next week's newsletter due to a dramatic move on Friday after the Newsletter is issued.
Listen To What He Says
From Isaiah 53:3-6 (KJV): (Think about it on this Easter Weekend)
"He is despised and rejected of men; a man of sorrows, and acquainted with grief: and we hid as it were our faces from him; he was despised, and we esteemed him not. Surely he hath borne our griefs, and carried our sorrows: yet we did esteem him stricken, smitten of God, and afflicted. But he was wounded for our transgressions, he was bruised for our iniquities: the chastisement of our peace was upon him; and with his stripes we are healed. All we like sheep have gone astray; we have turned every one to his own way; and the LORD hath laid on him the iniquity of us all."
I am still working on the Art of Listening, and hope that you are also!


