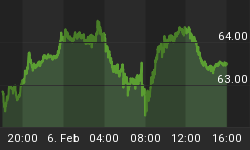
Despite good news from Europe and good US data SPX failed to clear above Friday's hod extending the up leg from the November 16 lod. The doubts I expressed yesterday regarding the meaning of Monday's Harami is now leaning towards the idea that price has completed the first up leg of a potential Zig Zag from the November lows.
I also mentioned that we have technical indications that are suggesting that the odds are favouring a retracement of this up leg.
I reiterate that the NYSE Adv-Dec Volume, which signalled a negative divergence last Friday it has kept falling and it is now well below the zero line suggesting distribution.

In addition today we also have a sell signal issued by the daily stochastic of the McClellan Oscillator. (Keep in mind that bulls are fine as long as the oscillator remains above the zero line)

VIX, with a bullish hammer (and a higher low from Thursday lod), is also hinting that it has opened the door for a move towards the gap fill = 16.41 or even at the 20 dma = 17, depending upon how the SPX bearish short term set up evolves.
Here we have to watch the trend line resistance of the RSI.
Bears have a potential Double Top bearish set-up pending confirmation by a breaking down of the pivot support at 1397.64.
If this is achieved today then the pattern has a target at 1386 provided bulls fail to hold price above the 20 dma = 1393.
The alt scenario would be a larger sideways pattern (TZZ) if bears waste this opportunity, but breadth indicators are aligned on their side, hence my short-term bias is bearish.
So I have a bearish bias but my preferred scenario remains unchanged since I am expecting just a Fibonacci retracement of the up leg off the November 16 low, maybe with a little luck price will retest the 200 dma = 1384 offering a "nice" opportunity to open long positions.
If my scenario plays out price will unfold a Zig Zag from the November lows hence a wave (C) up should follow the current pullback with a potential length of 66 points.
This scenario is strengthened by the corrective internal structure of the current pattern.
If Bulls are taking a breather and price unfolds a downward corrective pattern then the next battle will be fought first at the 20 dma then at the 200 dma. While on the upside the assumed wave (C) up will find strong resistance in the range 1425 - 1433.
For the reasons that I have suggested tons of times I remain sceptical that price has established a major bottom at the November lows, instead I am looking for either:
-
A larger Zig Zag in which case once the current corrective rebound is over price could establish THE BOTTOM with a lower low (This scenario will be the frontrunner if price bulls fail at 1433) or
-
A flat, in which case price could revisit the September high (or a lower low) followed by a retest of the November lows.
Both patterns are expected to complete the correction off the September high and open the door of the ignition of the intermediate up trend within the "bearish" wave (X) from the 2009 lows.
BUT like it happened last June when "everything" was suggesting a larger corrective pattern price instead fooled most EW investors establishing a major bottom, so at the moment even if, in my opinion, this out come has less chances of being the correct one I cannot rule it out.
Below in the daily SPX chart I highlight the 2 preferred paths:
Regarding the momentum picture:
RSI by breaching the trend line support off the November 15 low and with the loss of the 50 line is suggesting a waning of intensity of the move
The Stochastic has not confirmed yet a reversal.
If a downward pullback takes place then the MACD must not reverse the bullish signal cross-issued on November 21.


