


After the latest cliff-induced selloff Wednesday afternoon, the S&P 500 futures were holding up well early Thursday. According to the Washington Post, Republicans are moving forward with Plan B:
House GOP leaders scrambled to rally their members Wednesday behind a plan to extend tax cuts on income up to $1 million, defying President Obama's veto threat and setting up a showdown that could send Washington over the year-end 'fiscal-cliff'...A House vote on the plan, scheduled for Thursday, poses a major political test for Boehner's leadership team, which is pitching it as a vote of confidence and a way for Republicans to extract more concessions from Obama in negotiations over government spending and taxes.
Bullish Pattern Still In Play
On December 12, we showed a potentially bullish inverted head-and-shoulders pattern for the S&P 500. We also hypothesized the neckline could act as support on any subsequent weakness. As the updated version of the chart below shows, the neckline did provide support above the green arrow. The thin blue trendlines show a bullish trend channel for stocks. Should the fiscal cliff talks spook the markets over the next few days, possible support sits between 1,410 and 1,425.

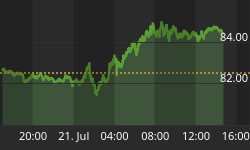
Bonds: A Reduction In Recession Fears
Treasury bonds are in higher demand when investors are concerned about future economic and political outcomes. The break of the lower blue trendline below is bearish for bonds and bullish for stocks. If bonds find buyers, the thick blue trendline may now act as resistance. The chart below shows decreasing investor concerns about a cliff-induced recession in 2013.

Press Conferences, But No Details On Cuts
We all know the eventual outcome of the current budget "crisis". It will involve some tax increases, some spending cuts, and a ton of kicking the can down the road. According to the New York Times, and not surprisingly, details on spending cuts have been hard to find:
Despite the dueling news conferences and stream of well-rehearsed sound bites from the White House and Congress about the budget talks, one element is still largely missing from the debate: details about spending cuts. Beyond numbers so large they are virtually meaningless to most Americans and a few specific proposals, like an adjustment to the Social Security formula, neither side has said much about how it wants to cut federal spending.
Fears Of Inflation Are Rising
The chart of interest rates below looks complex; the concepts are easy to follow if we look at them in isolation. Interest rates rise when demand for bonds falls (or when bonds experience a sell-off). The daily trend for interest rates is currently up. The blue dotted trendline shows interest rates made a higher low in November relative to September (bullish for rates and stocks). Three steps are required for a change in trend: (1) a break of a trendline (see dotted green line), (2) a higher low (see slope of pink line), and (3) a higher high (see move above dotted purple line). Rising interest rates align with decreasing fears of deflation and increasing concerns about future inflation.

The Charts Don't Lie - Updated
The chart below is an updated version of the one we first presented on December 14. The chart is representative of numerous weekly risk-on vs. risk-off charts used in the CCM Market Model. The graph shows the performance of stocks (SPY) relative to bonds (TLT). When the ratio (dotted line) rises, stocks are in favor relative to bonds (risk-on). When the ratio falls, bonds are in greater demand than stocks (risk-off). As you can see, as of Wednesday's close, the ratio was rising (risk-on). The chart compares the June-July bottoming process in stocks to the present day. The annotations are described in more detail below the chart.

Bullish Set-Ups - Stocks vs. Bonds
-
To the right of the green dotted horizontal line, the ratio crossed above the two moving averages shown in blue and red. Follow the green dotted line up and notice how the S&P 500 performed after the ratio cleared the two moving averages (bullish for stocks). Now, look to the right and you will see the present day market is above both moving averages (leans bullish).
-
The blue dotted line highlights a "bullish moving average crossover" (blue > red). Today, we have the same bullish cross in place (as of Wednesday's close).
-
The orange dotted line shows where momentum (Wm%R) experienced a bullish centerline crossover (Wm%R > -50). We have the same bullish cross in place currently.
-
Follow the orange dotted line down to RSI; note a break above RSI 50 was followed by gains in the stock market (see top of chart). RSI closed Wednesday at 55.99 or in bullish territory for stocks.
-
The bottom of the chart shows a bullish MACD cross (black>red) that occurred in late July. Gains in the stock market followed. MACD is trying to complete a bullish cross this week. Since this is a weekly chart, it matters how it looks on Friday more so than Wednesday.
You can make an argument that bonds are skewed due to the fiscal cliff or that one chart does not mean all that much. The counter argument is numerous intermarket relationships have similar bullish signals.
Concerns Remain For Bulls
Markets rarely, if ever, make anything easy for anyone. Do we have concerns? Yes. Two charts covered in last week's video have not yet come over to the bullish/inflation camp. The first is ratio of stocks relative to the VIX Fear Index, which is described in this video segment. The second is the ratio of gold (GLD) to silver (SLV), which is explained in detail here. A third and most important concern is related to the concept of risk-on vs. risk off triangles described in this December 17 video segment.
Our approach has been and will continue to be to remain on the long side of the markets as long as the fundamentals and technicals allow. With egos and strong political views intertwined in the process to forge a broad framework to tame the federal debt, the odds of something going wrong must be respected. Therefore, flexibility and contingency plans for bullish and bearish outcomes are a must.


